Beyond Thresholds: Training an ML Bark Classifier on Dog Collar IMU Data
In our first post on the bark detection pipeline, we showed how a single threshold on jerk_3d_max gives a useful signal for detecting barks from a dog collar IMU. For any capture window where jerk_3d_max crosses 6.5 g/s, the rule calls it a bark. Simple, fast, and it runs entirely from sensor math. But single-threshold rules have a ceiling.
Where the Rule Breaks Down
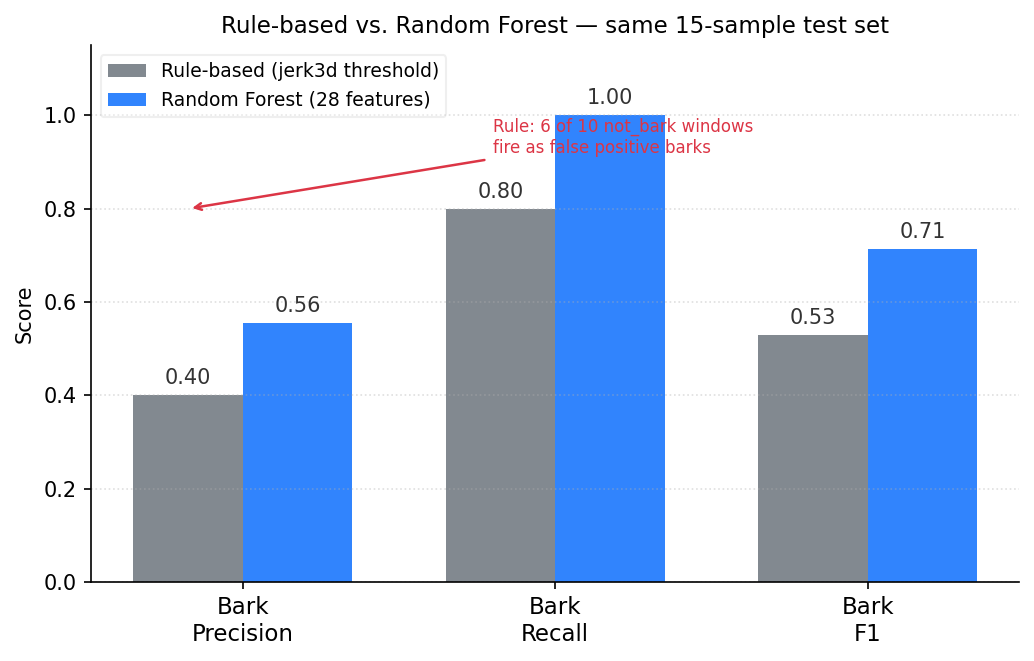
On our labeled test set of 15 clips across 4 recording sessions, the rule-based classifier achieves bark recall of 0.80 but bark precision of only 0.40. High recall means it catches most real barks. Low precision means 6 out of every 10 windows it labels bark are actually something else. We observed the same pattern in manual review: vigorous head shakes, collar adjustments, and fast movements produce jerk spikes that look identical to barks when you only look at the peak value.
The root cause is that jerk_3d_max captures peak intensity but ignores everything else: how long the spike lasts, how rhythmic it is, what the gyroscope was doing, where the signal energy falls in the frequency spectrum. A bark and a dog shaking off water after a swim can both push jerk_3d_max well above the threshold. The rule cannot tell them apart.
From a Threshold to a Feature Vector
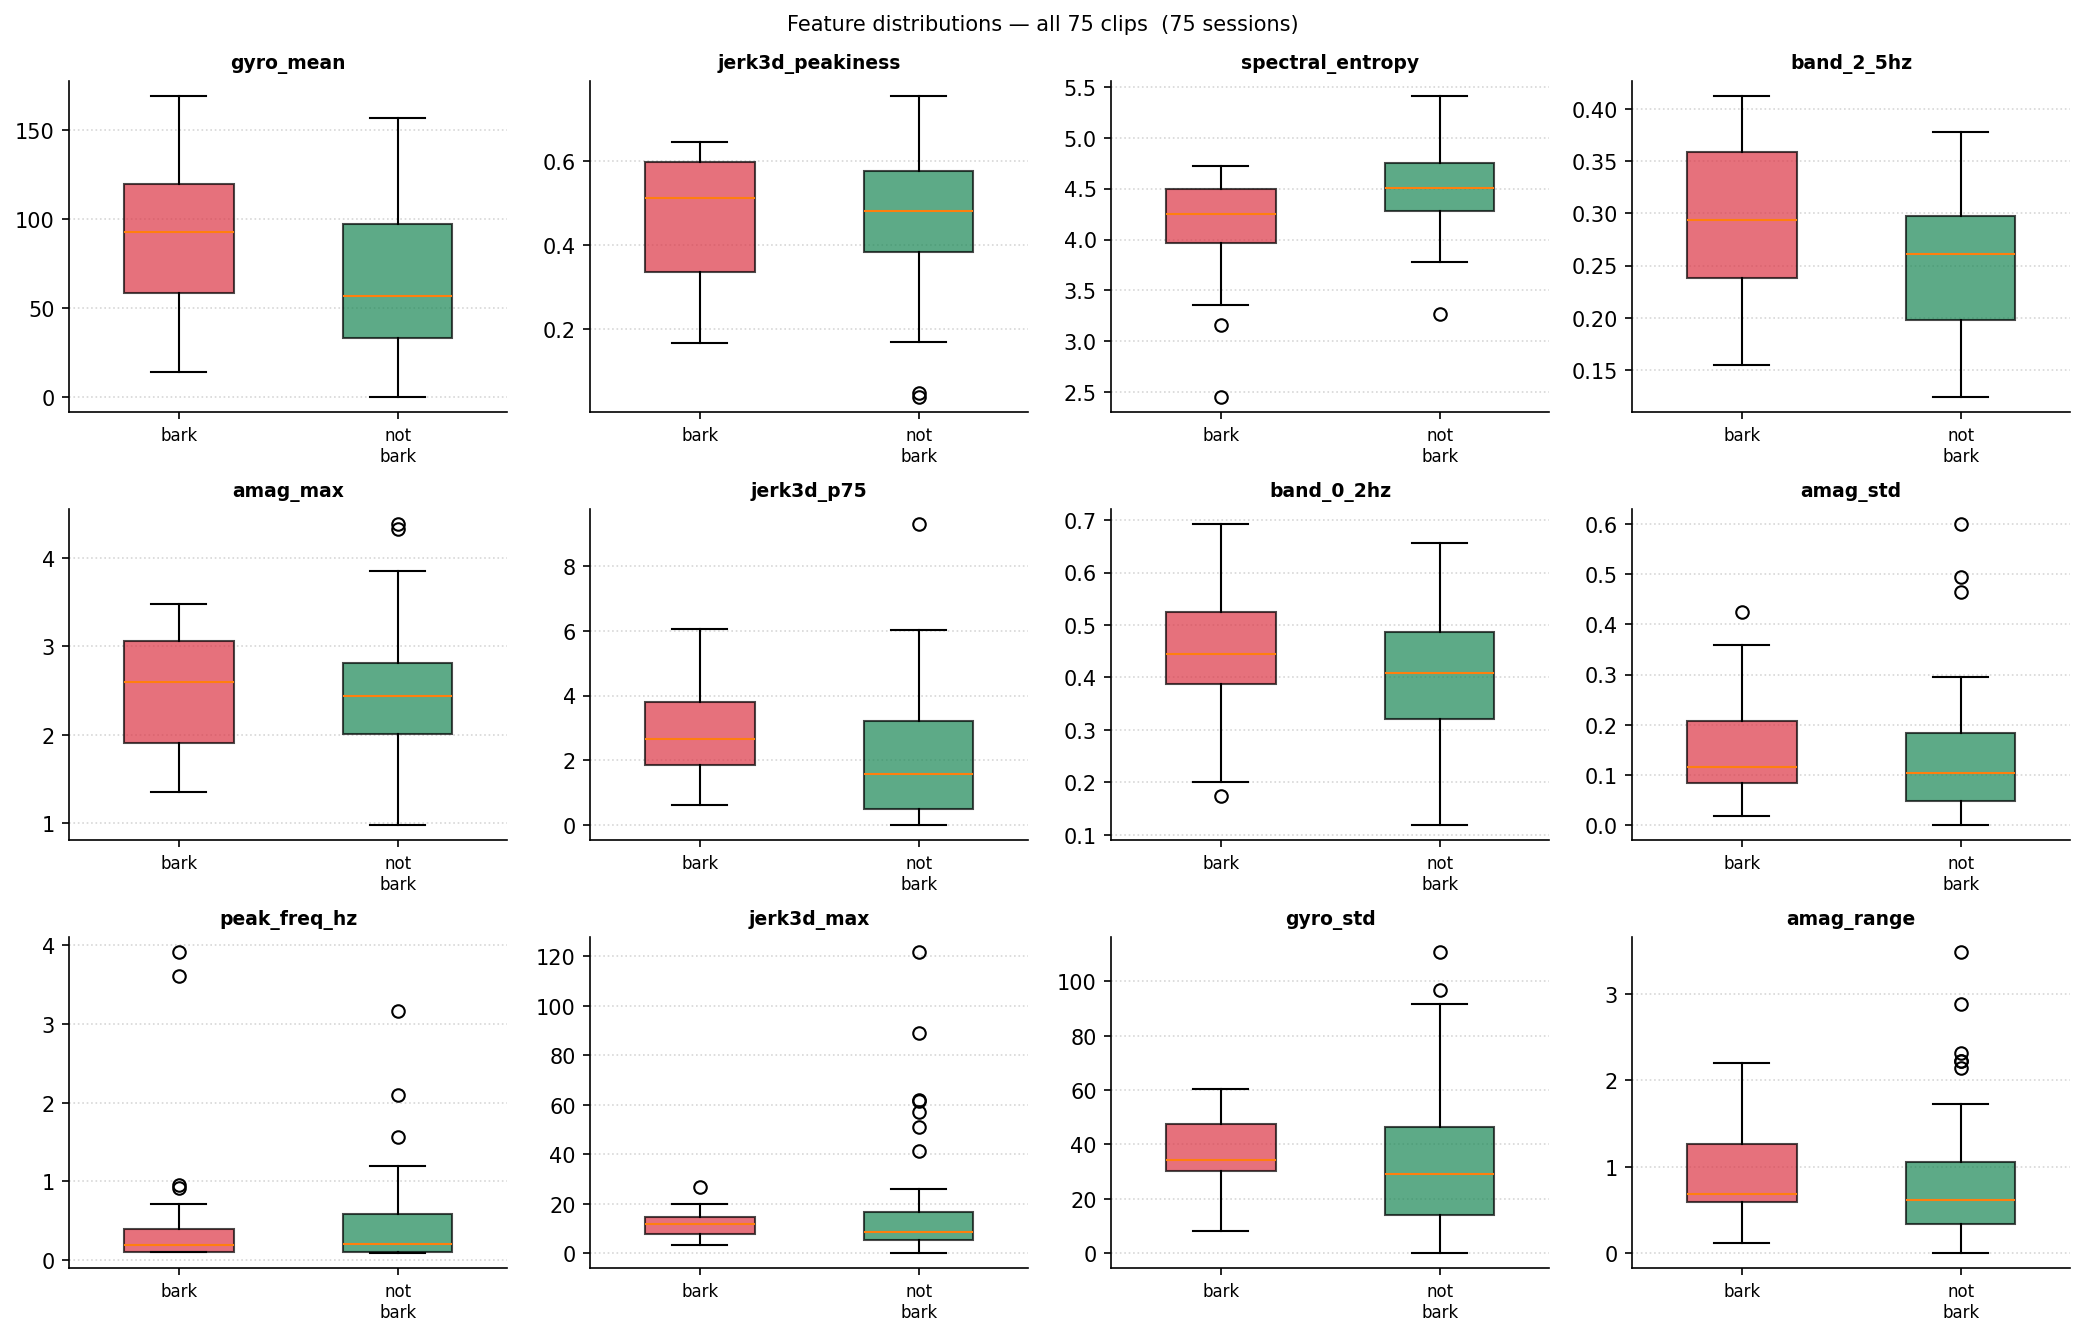
To give a classifier more to work with, we expanded from 1 feature to 28. Each capture window is now described by the following feature groups:
jerk_3d statistics: max, mean, std, 75th and 95th percentile, fraction of samples above 3 g/s, max consecutive samples above 3 g/s and above 8 g/s, and a peakiness score.
Acceleration magnitude: mean, std, max, range, p75, p95, IQR, RMS, and fraction of still samples where amag falls below 1.10 g.
Gyroscope magnitude: max, mean, std.
Spectral features on acceleration magnitude: dominant frequency in Hz, fraction of energy in 0-2 Hz, 2-5 Hz, and 5-15 Hz bands, spectral entropy.
Temporal texture: zero-crossing rate and lag-1 autocorrelation of detrended acceleration magnitude.
The peakiness feature is worth highlighting. Barking tends to produce a rhythmic jerk burst at a characteristic cadence (roughly 1-8 Hz). A collar adjustment or vigorous shake is more irregular. We compute peakiness as the normalized autocorrelation at the best lag in the 125 ms to 1 s range. A high score means the signal repeats at a regular cadence; a low score means it does not.
Building the Dataset
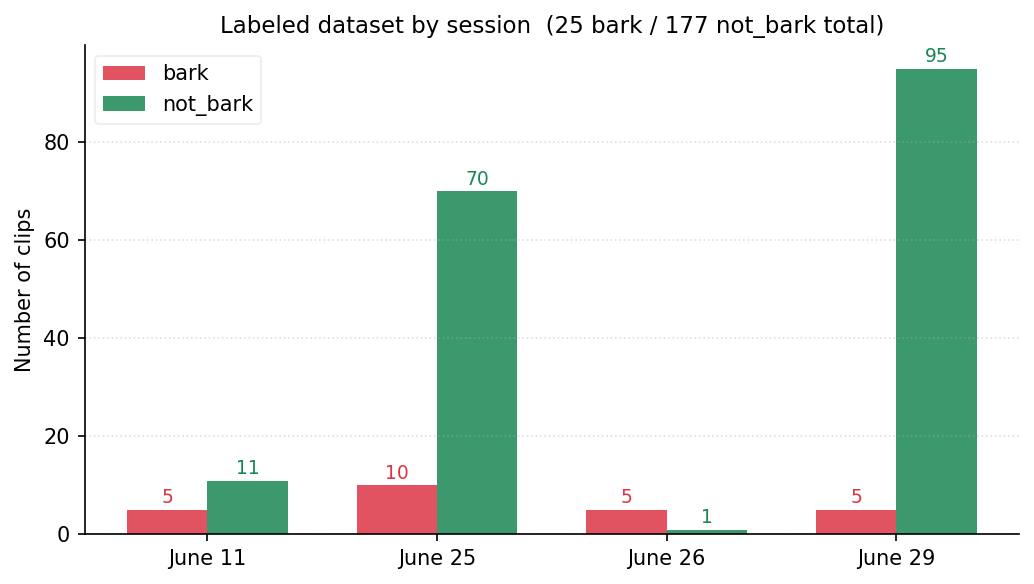
Labels are binary- bark vs not_bark. We collected ground truth labels across 4 recording sessions by reviewing audio clips matched to IMU windows. 202 total labeled clips: 25 bark, 177 not_bark. The class imbalance reflects real-world use since the collar records audio continuously and most clips are ordinary movement or rest.
To keep training manageable, we cap not_bark at 2x the bark count, randomly subsampling 177 down to 50. Working dataset: 75 samples (25 bark, 50 not_bark). We split 80/20 with stratified shuffle: 60 in train (20 bark, 40 not_bark), 15 in test (5 bark, 10 not_bark).
Model Selection
We compared two tree-ensemble candidates using 5-fold stratified cross-validation on the training set, scored by macro F1:
RandomForest (300 trees, balanced weights, sqrt max_features):
CV F1-macro 0.614

GradientBoosting (200 trees, max_depth=3, subsample=0.8):
CV F1-macro 0.582

Selected: RandomForest
Both models are wrapped in a StandardScaler pipeline since features like gyro magnitude and peak frequency live on very different scales from fractions and autocorrelations. Random Forest wins and is selected for evaluation on the held-out test set.
Results
On the held-out test set (the same 15 clips also used to evaluate the rule-based baseline):
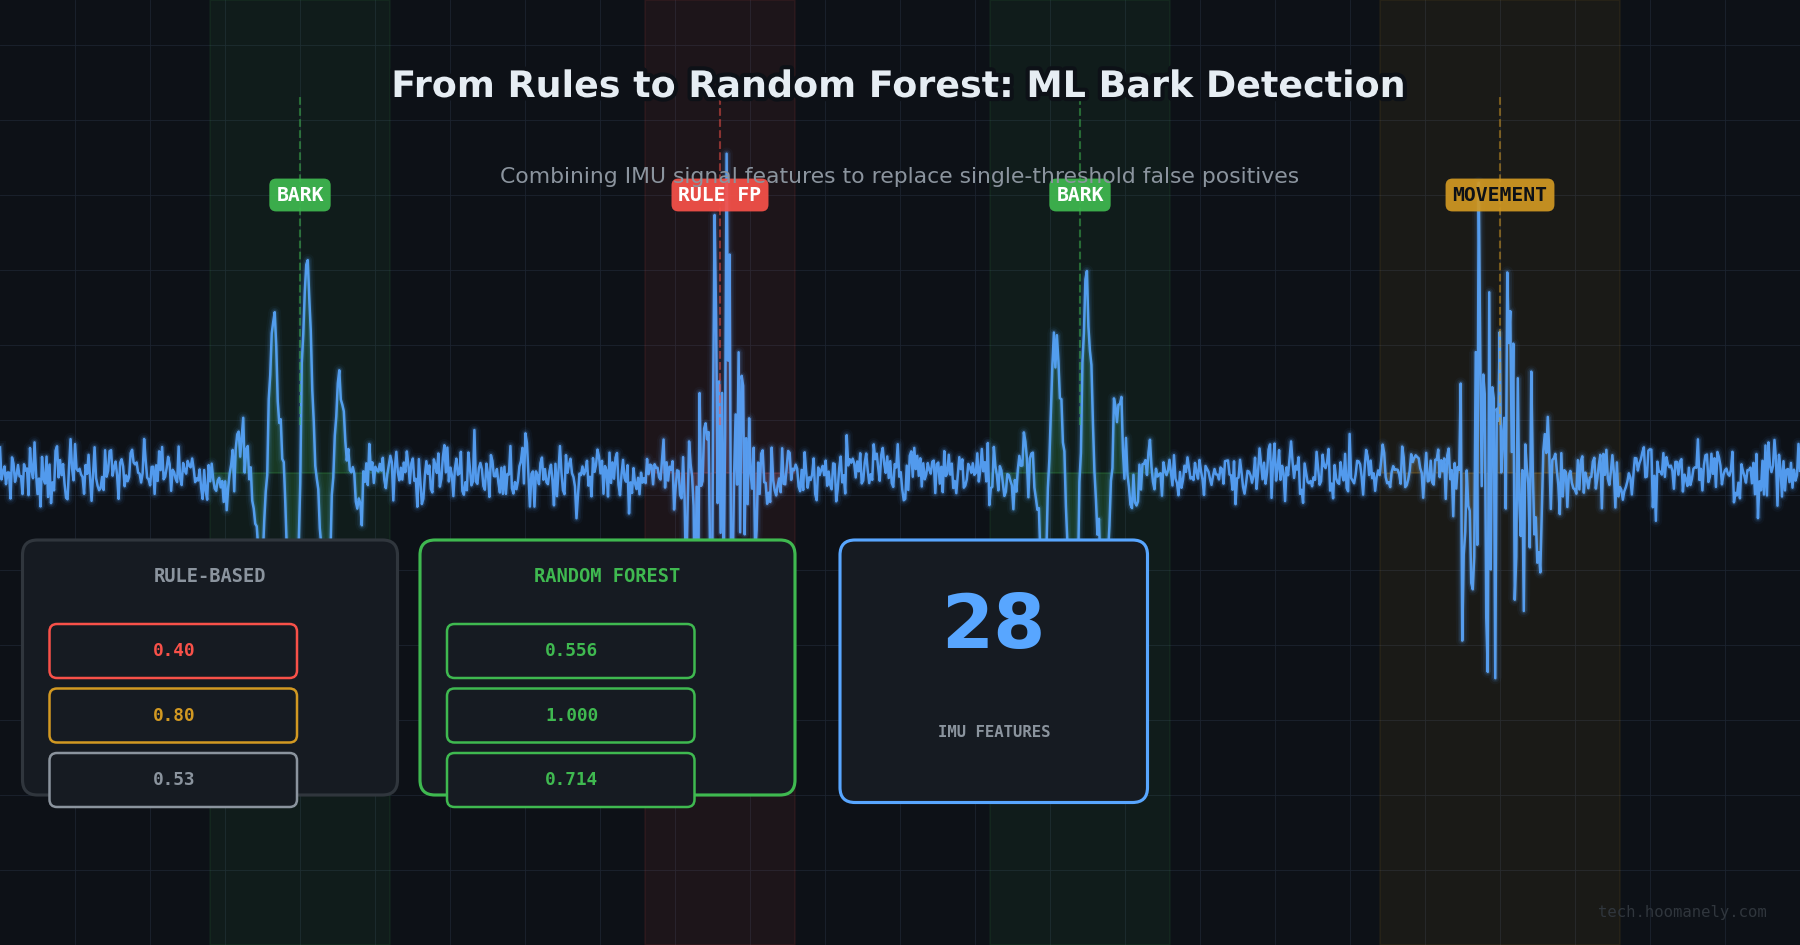
Bark precision : 0.556  (5 of 9 predicted bark were real barks)
Bark recall    : 1.000  (caught all 5 bark clips)
Bark F1        : 0.714
ROC-AUC        : 0.740
PR-AUC         : 0.605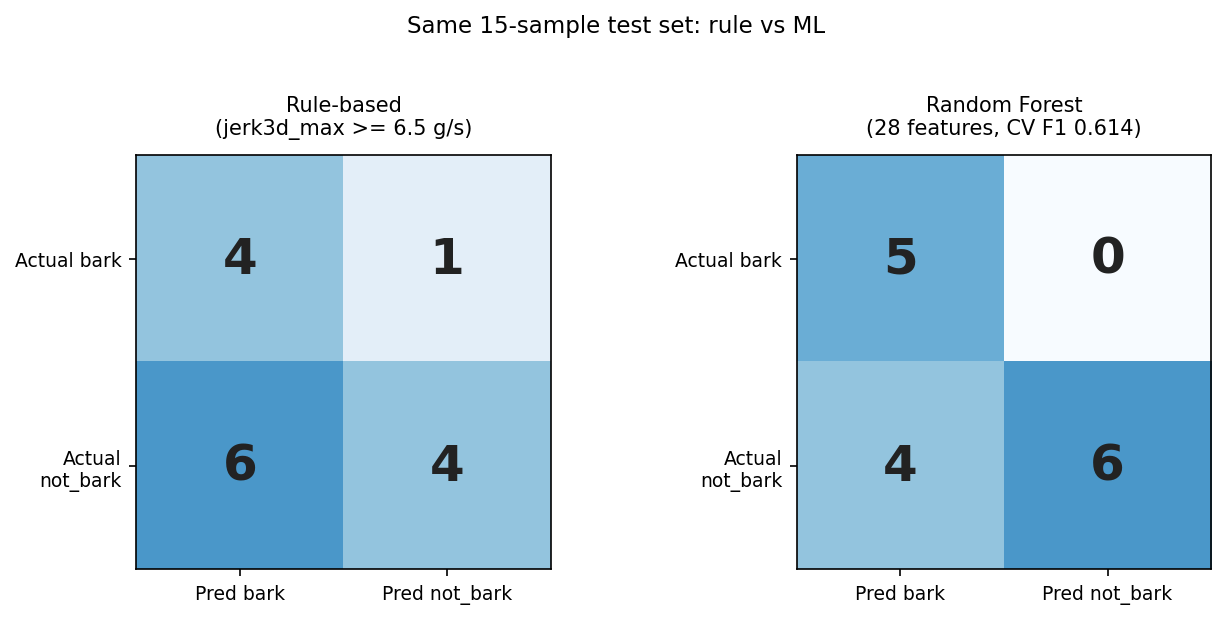
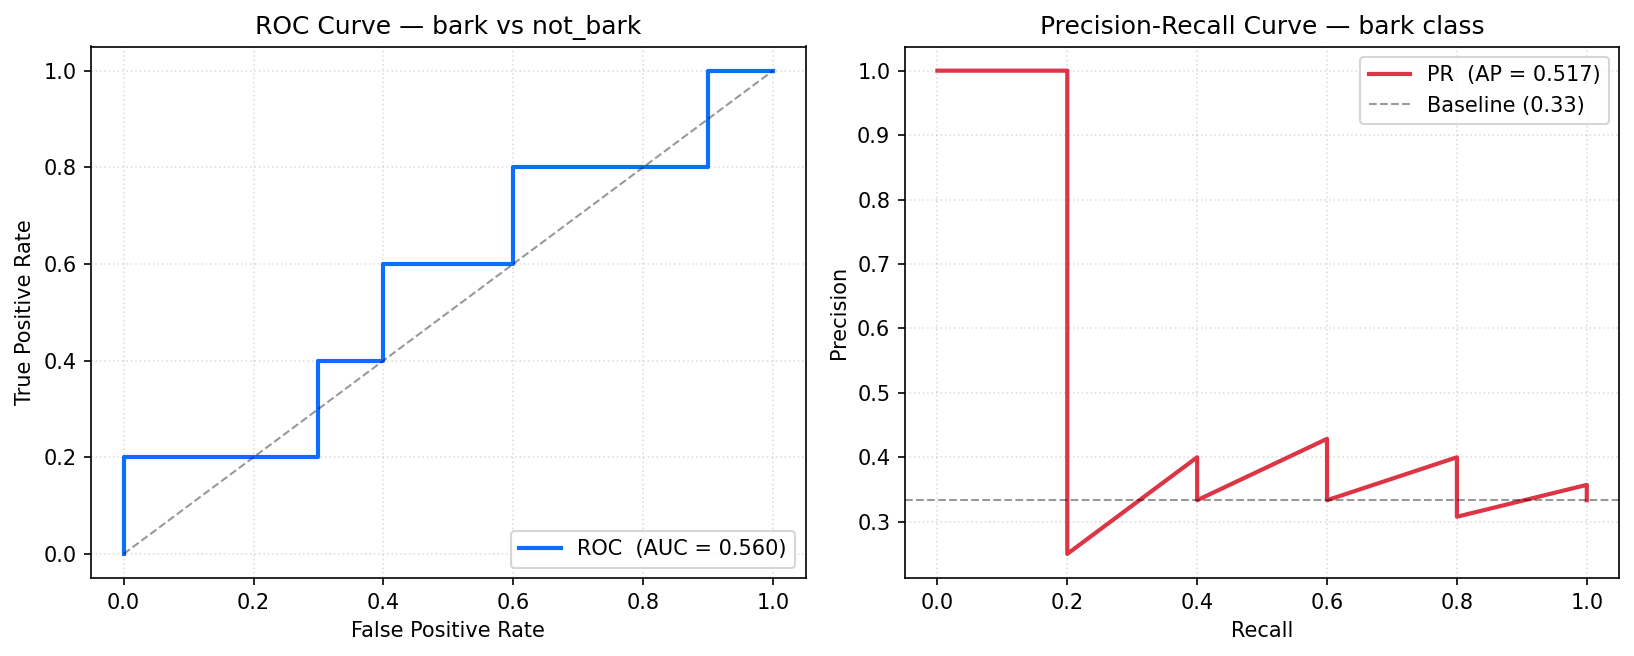
Compared to the rule on the same test set (precision 0.40, recall 0.80, F1 0.53), the Random Forest catches every bark while producing fewer false positives (4 FP vs 6 FP for the rule). The PR-AUC of 0.605 is the most informative single number here since the dataset is small and imbalanced. It will improve as bark sample count grows past 25.
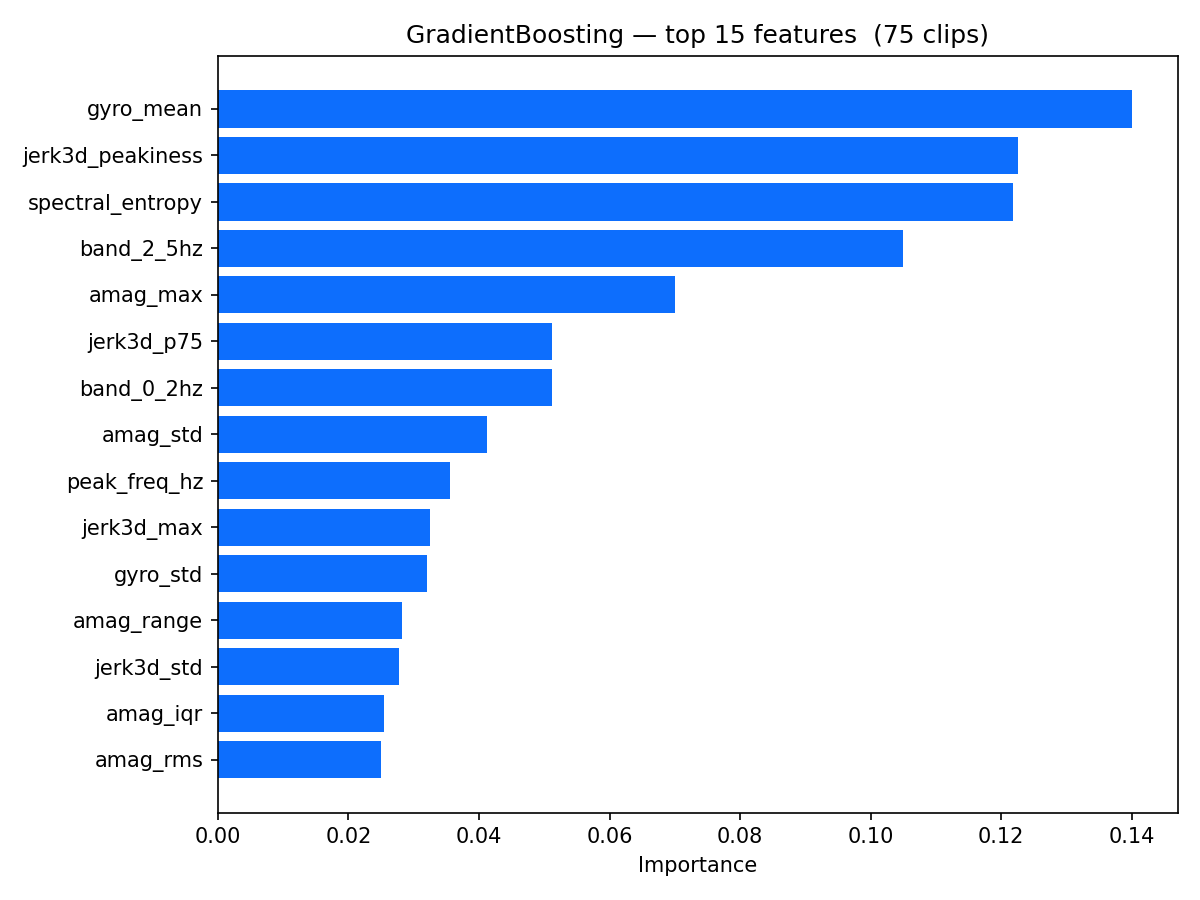
Feature importance from the trained Random Forest shows jerk3d_max, jerk3d_p95, and jerk3d_consec8 at the top, with spectral features and gyro contributing lower down. The model has learned that peak jerk and sustained high jerk are the strongest bark signals, while the full feature vector helps discount short-duration or irregular spikes that fool the threshold rule.
Honest Assessment
25 bark clips is a small sample and the model knows it. The 5-fold CV variance is high, and individual predictions on the test set move bark F1 by roughly 0.10. The current model's best asset is its recall: catching every bark in the test set means it misses nothing. The 4 false positives are the cost of that, and they should decrease as more labeled bark data is added.
What Is Next
Label more bark clips from ongoing recording sessions to push past 100 examples, where we expect precision to tighten substantially.
Explore per-session calibration to handle variation in collar fit across dogs or mounting positions.
Experiment with temporal context by feeding consecutive 2-second windows to a lightweight sequence model, so the history of the last few seconds can help resolve ambiguous clips.