Designing for Zero Heap: Static Memory on a 1 KB Stack

There is a particular kind of failure that haunts always-on devices, and it almost never shows up in the lab. The firmware runs perfectly for a day, a week, a month — and then, somewhere out in the field, it quietly stops. No crash log, no stack trace, just a device that was healthy yesterday and unresponsive today. When you finally get it back on the bench and dig in, the culprit is often the same: the heap. Somewhere over those weeks, thousands of small allocations and frees left memory carved into useless slivers, and the one allocation that mattered — the buffer for the next sensor reading — returned NULL. The device didn't crash because it was broken. It crashed because it ran out of room to think.
On the daughterboard that drives Hoomanely's always-on health monitor, we don't get to debug that failure in the field. The board sits inside a hub that is expected to run for months without a reboot, sampling a sensor continuously and never silently going dark. So we made a decision early: this firmware allocates nothing at runtime. No malloc, no free, no heap growth, no fragmentation — and therefore no slow-motion memory death three weeks into a deployment. This post is about what a no-malloc discipline actually looks like in practice, on a part where you have roughly 512 bytes of heap and 1 KB of stack to work with.
The Concept: Determinism Is a Memory Property
When engineers hear "don't use malloc," they usually think the concern is running out of memory. On a small part that is true, but it isn't the deepest reason. The deepest reason is determinism. A dynamic allocator's behavior depends on the entire history of allocations that came before it. The same line of code — the same malloc(64) — might return instantly on boot, take a few hundred cycles after an hour, and fail outright after a month, purely because of how the free list has been chopped up over time. Your firmware's worst-case timing and worst-case memory are no longer properties you can read off the source code. They are emergent properties of a system you cannot fully test.
Static allocation flips that on its head. If every buffer the firmware will ever use is reserved at compile time, then the linker can tell you — before the device has ever powered on — exactly how much RAM you need. There is no free list to fragment, no allocation that can fail at hour 700 but not hour 1, and no codepath whose timing depends on what ran before it. The memory map becomes a fixed, knowable thing. For an always-on node, that predictability is worth more than the flexibility malloc offers, because the flexibility is precisely what kills it.
Reading the Linker Script: Where Heap and Stack Actually Live
Before you can reason about a no-heap design, you need to know where these regions physically sit. On the STM32C0 we use, RAM is a single contiguous block — 6 KB on the smaller variant — and the linker script is the document that decides how that block is carved up. It is the single source of truth for the memory map, and most developers never read it carefully.
The relevant part is short. The MEMORY block declares the physical regions, and a handful of symbols pin down where the stack and heap live inside RAM:
/* STM32C011 - 6 KB SRAM, single contiguous region */
MEMORY
{
FLASH (rx) : ORIGIN = 0x08000000, LENGTH = 32K
RAM (xrw) : ORIGIN = 0x20000000, LENGTH = 6K
}
/* Stack grows DOWN from the top of RAM */
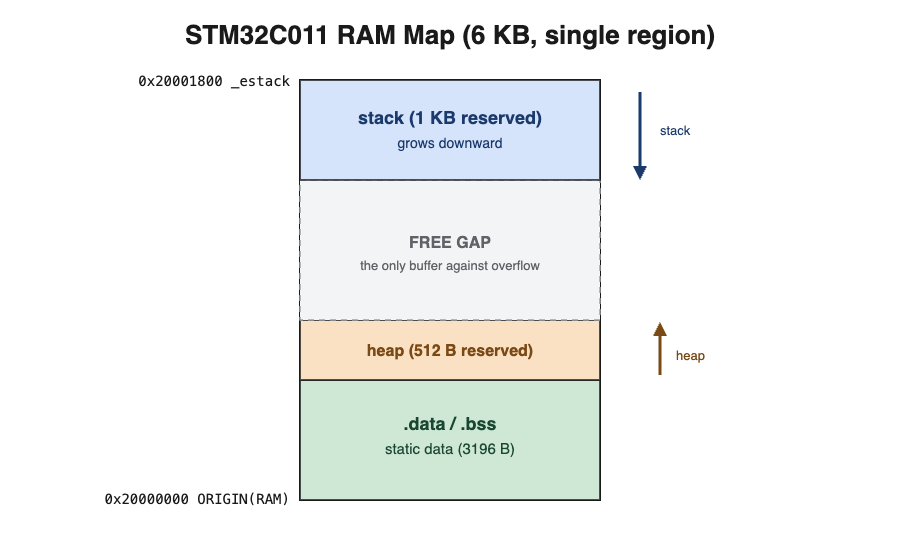
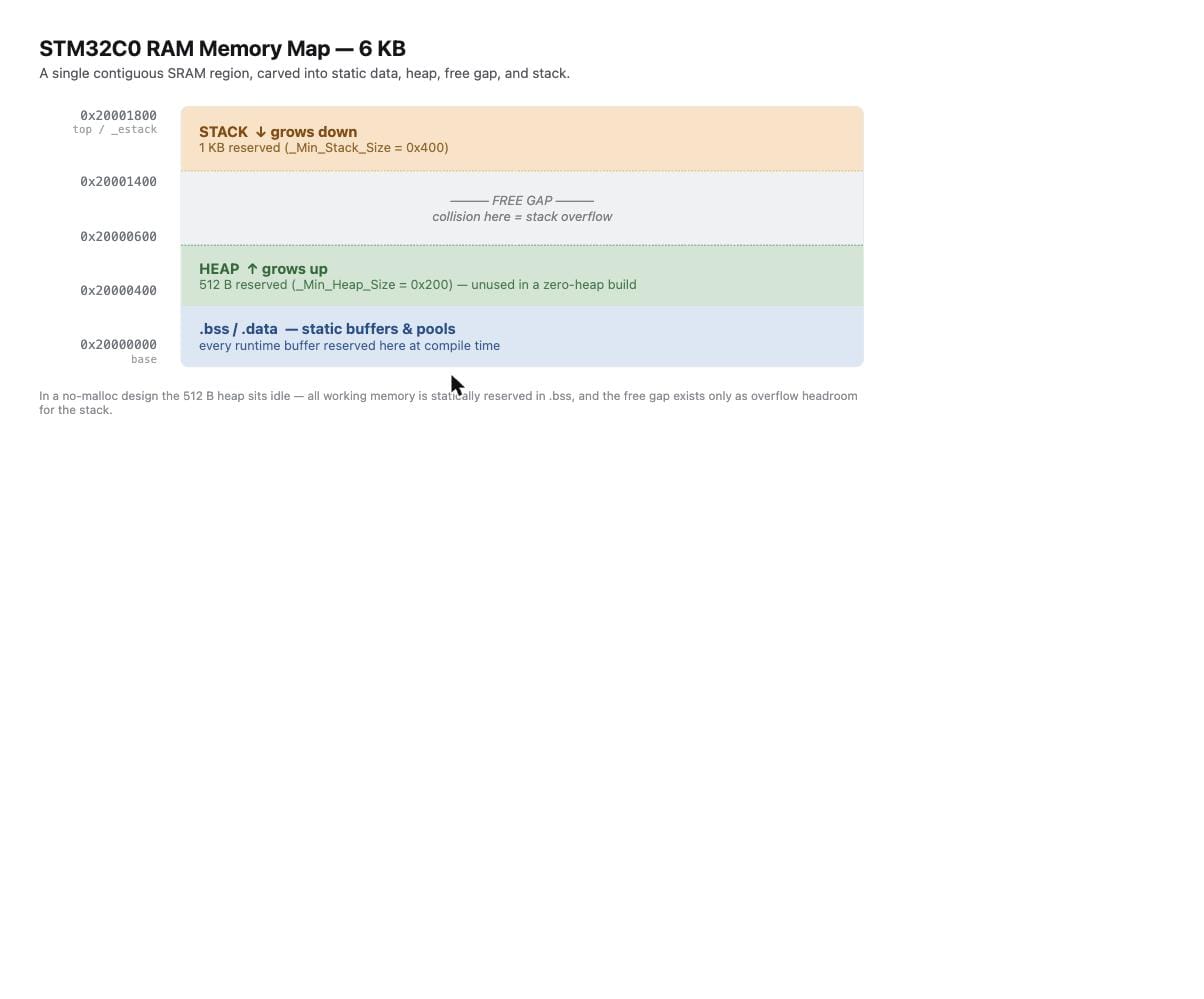
_estack = ORIGIN(RAM) + LENGTH(RAM); /* 0x20001800 */
_Min_Heap_Size = 0x200; /* 512 B reserved for heap */
_Min_Stack_Size = 0x400; /* 1 KB reserved for stack */Two things are worth internalizing here. First, the stack and heap grow toward each other from opposite ends of the same region. The stack starts at the very top (the _estack symbol) and grows downward as functions are called; the heap, if you use one, starts above the static data and grows upward. The empty space between them is the only thing standing between a deep call chain and silent corruption. Second, the heap and stack size symbols are not limits the hardware enforces — they are reservations the linker checks at link time. If your static data plus these reservations exceed the RAM region, the build fails. That is exactly the behavior we want: the failure happens on a developer's machine, not on a dog's collar.
Once you have read the script, the memory map stops being abstract. You can point at an address and say what lives there. For the always-on monitor, sketching that map by hand was the first step in trusting that the device would still be running months later.
Static Buffers and Pools vs malloc: Sizing the Worst Case
The whole no-malloc discipline rests on one habit: every piece of memory the firmware will ever touch is declared once, at file scope, and lives for the entire life of the program. A sensor frame buffer is not allocated when a reading arrives and freed when it is processed — it simply exists, always, in the BSS section. The cost is a fixed slab of RAM you pay for up front. The benefit is that the slab can never fail to materialize, never fragment, and never surprise you at hour 700.
For a single buffer this is trivial. The interesting case is when you would normally reach for malloc in a loop — handing out and reclaiming small objects. The static answer is a fixed-size pool: a static array of objects plus a small free list, where claiming an object means popping an index and releasing it means pushing the index back. The pool has a hard ceiling, and that ceiling is the point. If the system ever needs more objects than the pool holds, you want to discover that as an explicit, testable error, not as a malloc that quietly succeeds today and fails next month.
A minimal pool for our sensor sample records looks like this. Note that the entire capacity is visible to the linker, and there is not a single call to malloc:
#define SAMPLE_POOL_SIZE 8   /* worst case: 8 in flight */

typedef struct {
    uint32_t timestamp;
    int16_t  values[6];
    bool     in_use;
} sample_t;
static sample_t g_sample_pool[SAMPLE_POOL_SIZE];
sample_t *sample_acquire(void) {
    for (size_t i = 0; i < SAMPLE_POOL_SIZE; i++) {
        if (!g_sample_pool[i].in_use) {
            g_sample_pool[i].in_use = true;
            return &g_sample_pool[i];
        }
    }
    return NULL;   /* pool exhausted: explicit, testable failure */
}
void sample_release(sample_t *s) {
    if (s) s->in_use = false;   /* no free(): slot is simply reusable */
}
The discipline that makes this work is sizing the worst case honestly. With dynamic allocation you can be sloppy, because the heap papers over peaks by borrowing from a shared pool. With static pools there is no shared pool, so you have to ask the uncomfortable question up front: what is the absolute maximum number of these objects that can be live at once? For our sensor node the answer came from the data path itself — at most a handful of samples can be buffered between acquisition and processing before the consumer catches up. We sized the pool for that peak, added a small margin, and then made exhaustion a logged, counted event so any future surprise shows up in telemetry rather than as a silent failure.
Catching Stack Overflow Early: Fill Patterns and Watermarks
Removing the heap removes one whole class of failure, but it sharpens another. With a 1 KB stack and no heap to absorb mistakes, the stack is now the most dangerous region in the system. It grows silently with every nested function call and every large local variable, and when it grows past its reservation it does not throw an error — it simply writes over whatever sits below it in RAM, usually your static data. The corruption shows up later, somewhere unrelated, as a value that mysteriously changed on its own. On a 32 KB part with a huge stack you might never notice; on a 1 KB stack, a deep call chain plus one oversized buffer on the stack is all it takes.
The classic technique for catching this cheaply is stack painting. At startup, before main really gets going, you fill the entire stack region with a known sentinel value — 0xDEADBEEF is traditional. As the program runs, the stack uses as much depth as it needs, overwriting the sentinel from the top down. At any later point you can walk from the bottom of the stack region upward, counting how many sentinel words are still intact. The first overwritten word marks the high-water mark: the deepest the stack has ever gone. Subtract that from the total and you know exactly how much headroom you have left.
#define STACK_FILL  0xDEADBEEFu
extern uint32_t _sstack, _estack;   /* from the linker script */
/* Call once at boot, before deep call chains run. */
void stack_paint(void) {
    for (uint32_t *p = &_sstack; p < &_estack; p++)
        *p = STACK_FILL;
}
size_t stack_unused(void) {
    uint32_t *p = &_sstack;
    while (p < &_estack && *p == STACK_FILL) p++;
    return (size_t)((uint8_t *)p - (uint8_t *)&_sstack);
}
Two practices turn this from a debugging trick into a safety net. The first is reporting the watermark as telemetry: our node periodically computes its unused-stack figure and folds it into the health data it already sends upstream, so we can watch the worst-case depth across a whole fleet rather than guessing from one bench unit. The second is keeping a deliberate guard band — a few sentinel words at the very bottom of the stack that should never be touched. If those specific words ever change, we are dangerously close to overflow, and the firmware can react before corruption happens: log loudly, increment a fault counter, and let the watchdog take it from there. The difference between this and a raw crash is enormous: instead of a mystery reboot weeks later, you get a precise, early warning with the exact margin attached.
It is worth knowing that on Cortex-M parts there is also a hardware backstop. The MSP — the main stack pointer — can be paired with a stack-limit register on newer cores, or on the STM32C0 you can place the stack so that an overrun runs into an unmapped or write-protected region and faults immediately. Hardware detection is the seatbelt; the fill-pattern watermark is the dashboard warning light that tells you the margin is shrinking long before you hit the wall.
Verifying Footprint With arm-none-eabi-size in CI
All of this discipline is only worth anything if it is enforced automatically. A no-malloc design quietly drifts back toward danger as features are added: a new buffer here, a larger struct there, and suddenly the static footprint has eaten into the headroom you were counting on. The fix is to treat memory footprint as a build artifact and check it in CI, on every commit, the same way you would run unit tests.
The humble tool for this is arm-none-eabi-size, which reads the compiled ELF and reports the size of each section. The numbers that matter for RAM are .data (initialised globals) and .bss (zero-initialised globals); together they are your static footprint, and they must leave room for the stack and heap reservations inside the 6 KB region.
$ arm-none-eabi-size -B build/sensor-node.elf
   text    data     bss     dec     hex filename
  18452     124    3072   21648    5490 build/sensor-node.elf

# RAM used by statics = data + bss = 124 + 3072 = 3196 B
# RAM total = 6144 B  ->  free for stack+heap = 2948 B
# Reserved (1 KB stack + 512 B heap) = 1536 B  ->  PASS
Wiring this into CI is a few lines of shell. After the build, a script parses the .data and .bss figures, adds the stack and heap reservations from the linker symbols, and fails the job if the total would not fit — ideally with a margin you choose deliberately, say a hard ceiling at 90 percent of RAM. The build going red on a pull request is exactly the moment you want to learn that a new feature pushed you over budget, because it is the cheapest possible place to find out. A red CI check costs a developer five minutes; a memory fault in a deployed health monitor costs a missing day of a pet's data and a truck roll.
The same job is a natural home for the stack watermark. A hardware-in-the-loop stage can run the firmware through its heaviest path, read back the unused-stack figure over the debug port, and assert that the high-water mark never crossed the guard band. Now both halves of the memory map — the static footprint and the dynamic stack depth — are guarded by automation rather than by anyone remembering to check.