How We Teach Machines to Hear: The Journey from Waves to Meaning
Introduction
We're building technology that helps us understand pets better, not just visually but through sound. Dogs communicate through subtle cues: the rhythm of a chew, a quiet gulp, a bark that changes tone when they're anxious. At Hoomanely, our smart bowls and monitoring systems use audio processing to turn raw noise into something structured we can act on.
This post covers how we teach machines to listen: how sound becomes numbers, how the Fourier Transform reveals hidden frequencies, where it falls short for real-world sounds, how Short-Time Fourier Transforms and Mel scales close those gaps, and how models like Mel-CNNs and Conv-TasNet take sound understanding further still.
Breaking down sound: the Fourier Transform
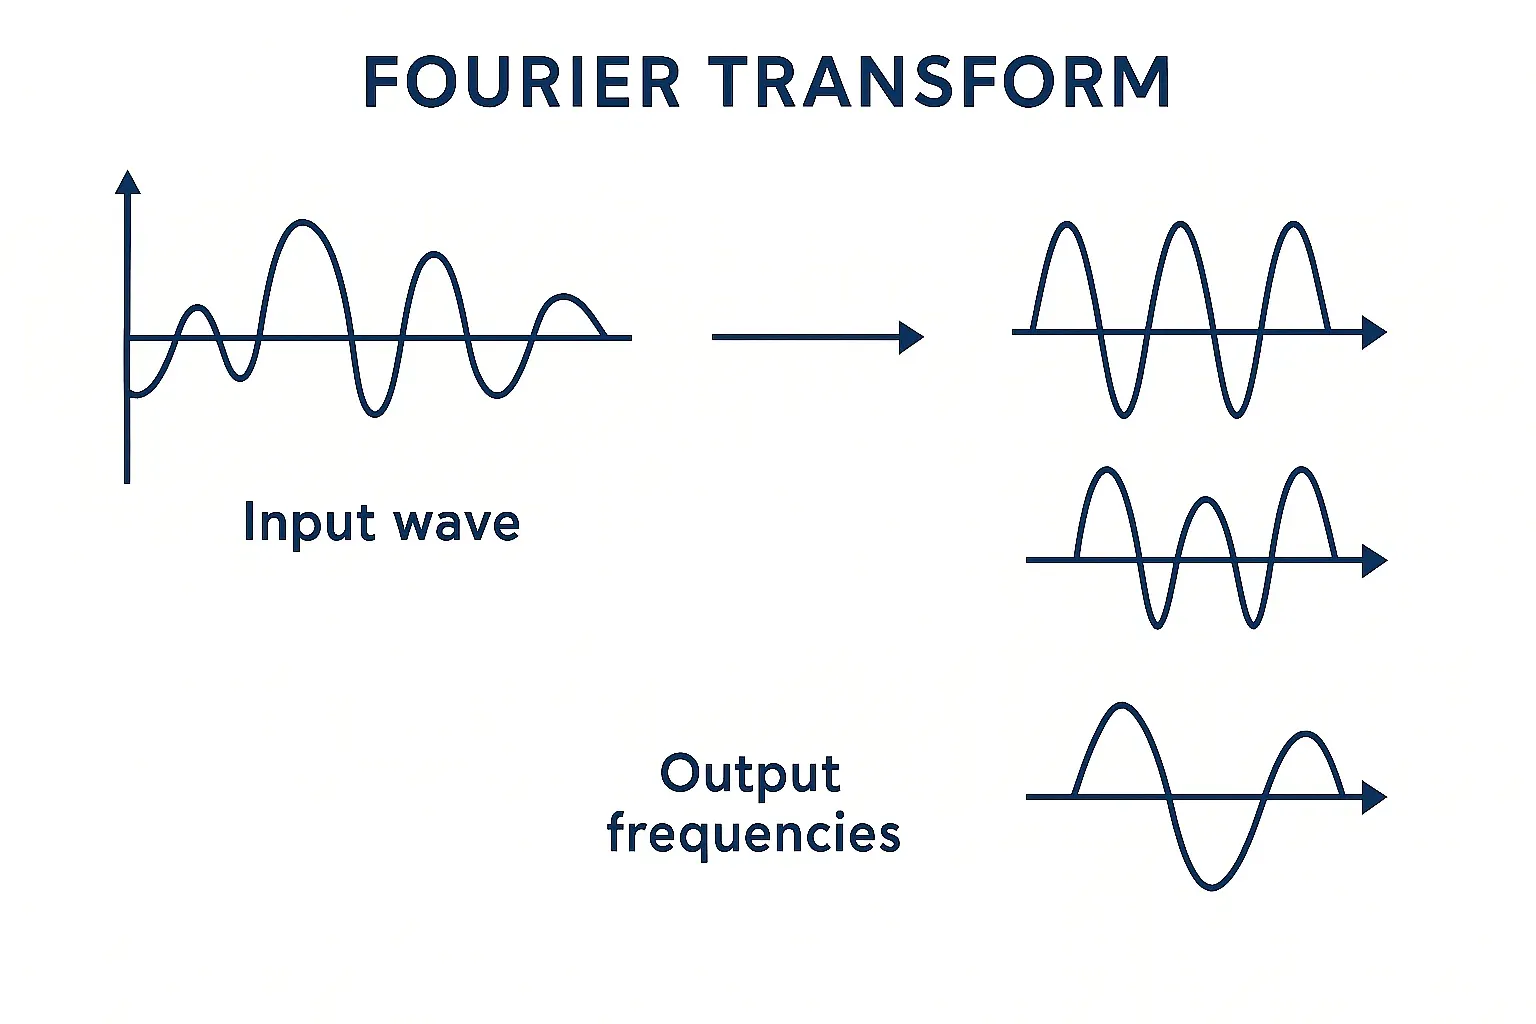
Picture recording a dog barking once and then chewing quietly. In the waveform, both look like squiggly lines, and the shape alone doesn't tell you which is which. What you actually need to know is which frequencies make up each sound.
The Fourier Transform breaks a complex sound into simpler parts, pure sine tones, and shows how strong each frequency is, essentially a list of ingredients for the sound. If a bark carries strong energy around 2000 Hz and chewing sits around 300 Hz, the Fourier Transform reveals exactly that.
But it has a limitation: it assumes the sound's content stays constant over time, what engineers call stationary. Real sounds like barking don't work that way. A bark starts loud, fades fast, and disappears; chewing repeats in short bursts. The Fourier Transform tells you what frequencies exist, not when they happen. It's a bit like knowing the ingredients of a song, bass, drums, guitar, without knowing when each one starts or stops.
When timing matters: the Short-Time Fourier Transform
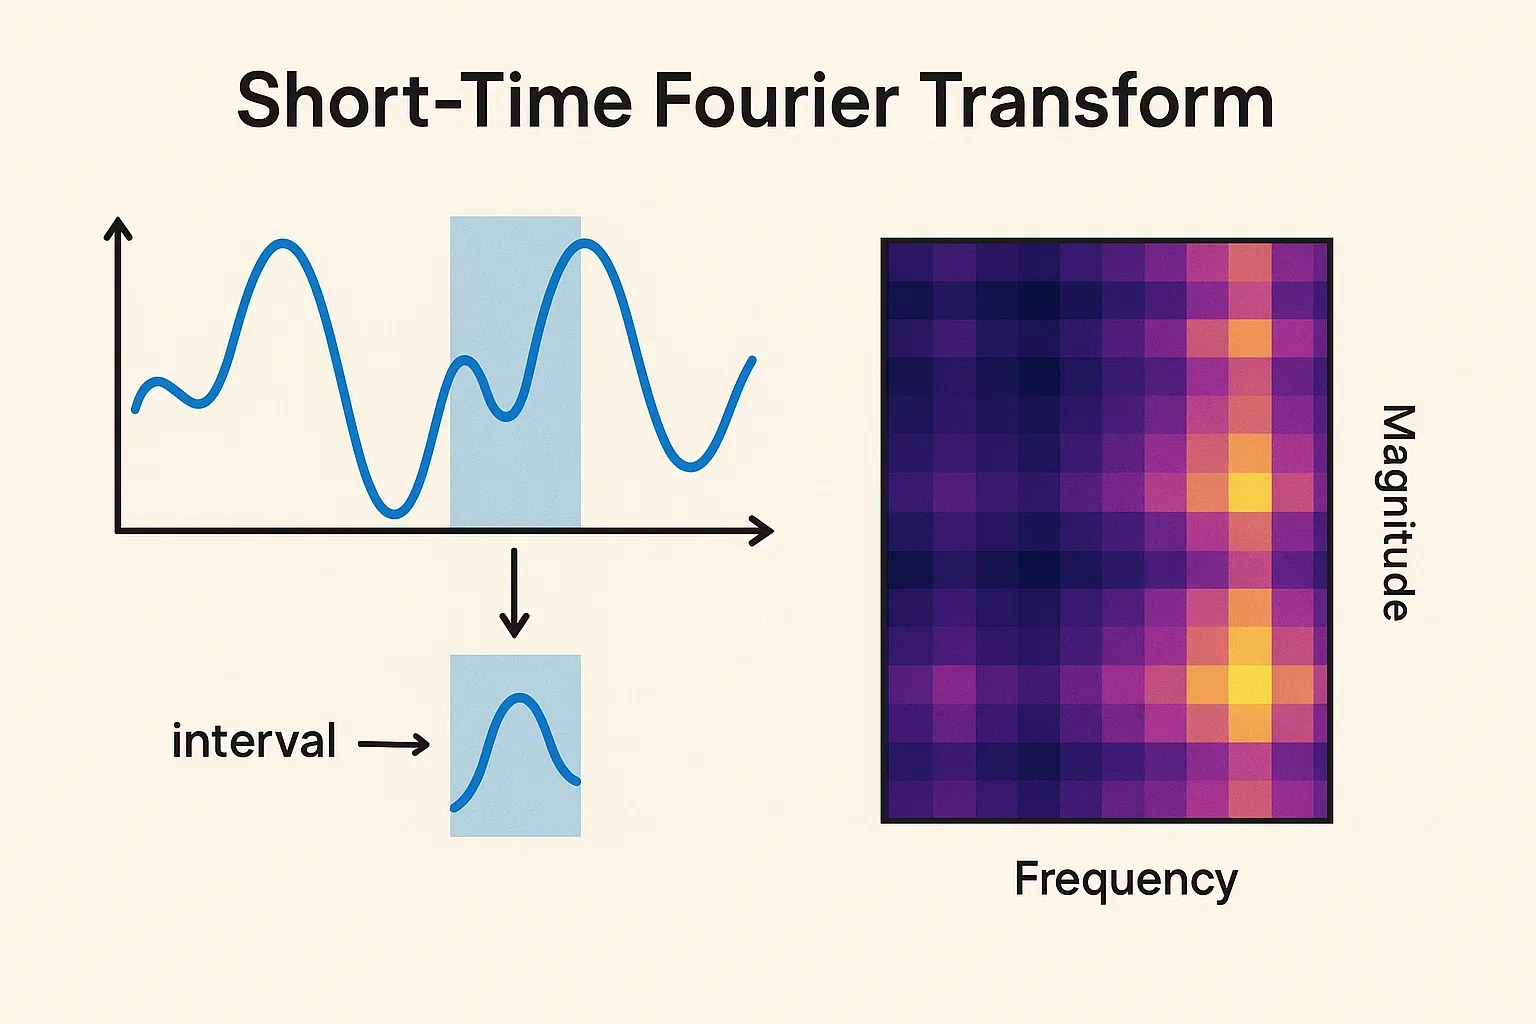
To understand sound as it changes, you need both what frequencies exist and when they occur. That's what the Short-Time Fourier Transform (STFT) gives you. It chops the sound into tiny overlapping pieces, around 25 milliseconds each, applies the Fourier Transform to each piece, and slides the window forward. That captures how frequencies evolve over time, giving both timing and frequency information at once. The output still isn't in a form neural networks can easily use directly, which is where the Mel scale comes in, turning this into a compact, image-like encoding a model can actually learn from.
Hearing like humans: the Mel scale
Our ears don't hear every frequency equally. We notice changes in low pitches far more than in high ones; a shift from 200 to 400 Hz sounds big, while 5000 to 5200 Hz barely registers. The Mel scale was built to mirror this, spacing frequencies the way we actually perceive them, tightly at low tones and more loosely at high ones.
Applying this scale to a spectrogram, which is a visual map of how sound energy changes over time and frequency, gives you a Mel Spectrogram: an image-based encoding that groups frequencies by how we naturally hear them, and one that CNNs can consume easily. Think of it like a piano keyboard where the lower notes take up more keys, because our ears can tell their differences apart better.
The Mel Spectrogram is easier for machines to work with: fewer features, less noise, and a focus on what actually matters for perception. It's essentially a way of encoding sound for a neural network to learn from, though the transformation does lose some information, specifically phase, which carries fine timing detail from the original waveform.
Seeing sound: how Mel-CNNs learn
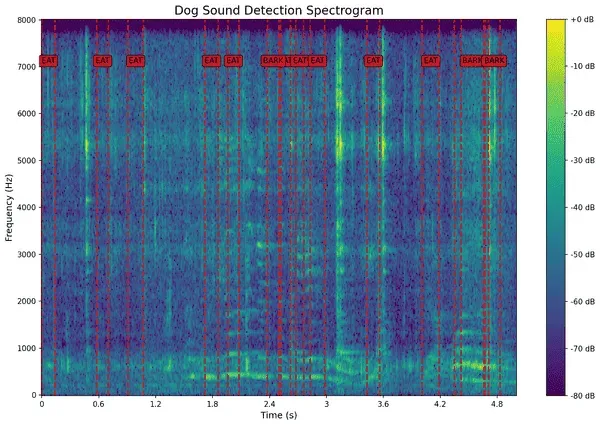
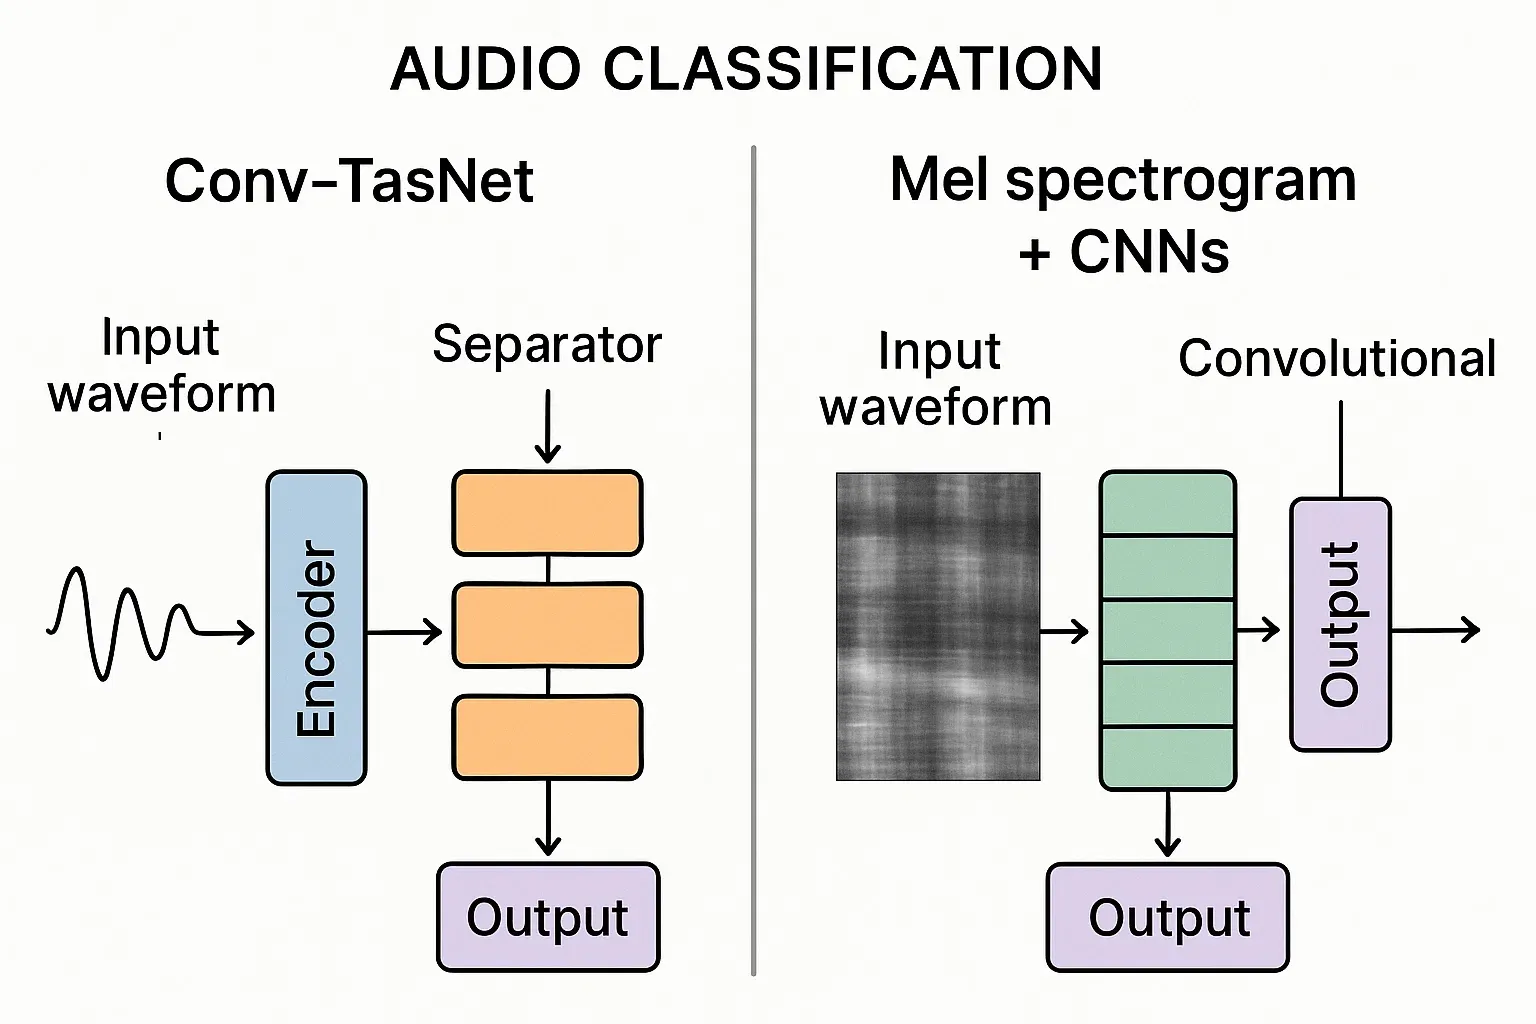
Once sound becomes a Mel Spectrogram, it looks like a picture, colors changing across time and frequency, so treating it like an image makes sense. That's the idea behind Mel-CNNs. A Mel-CNN scans these images for patterns, smooth waves for chewing, sharp spikes for barking, the same way it would spot edges or textures in a photo, and over time learns to tell one sound apart from another. It's a bit like training a camera to recognize dog breeds, except here it's recognizing sound shapes instead of fur patterns.
Mel-CNNs fit our use case well: they're lightweight enough for small devices, effective even with modest data, and work great for clear event detection like chew, gulp, or bark. Their main limitation is that they need precomputed spectrograms and can't capture fine timing detail (phase), but for identifying sounds, that's rarely a problem.
Going straight to the source: Conv-TasNet
While Mel-CNNs start from a prepared spectrogram, models like Conv-TasNet skip that step entirely and learn directly from the raw waveform. Conv-TasNet (Convolutional Time-domain Audio Separation Network) teaches itself how to hear, learning its own way to split and rebuild sounds without ever computing a Fourier Transform.
It has three main parts: an encoder that learns its own filters, essentially a custom-built Fourier Transform; a separator that works out which parts belong to which sound, chewing, barking, or background noise; and a decoder that reconstructs the clean, separated sounds. It's a bit like teaching a dog to recognize toys without labeling them, it figures out which sound belongs to what just by listening repeatedly.
Conv-TasNet keeps all the fine detail, phase and timing, and produces cleaner separation. It's well suited to cleaning up noisy recordings or generating training data, though it's heavier and needs more data than a Mel-CNN. For simple event detection like chewing or barking, Mel-CNNs are the better fit because they're lightweight and efficient. For cleaning noisy audio or separating overlapping sounds, Conv-TasNet wins on detail.
Picking the right tool
Together, they give us clean, efficient listening that holds up in real-world conditions.
Why it matters
Every sound a dog makes carries some meaning. Fast gulping can hint at anxiety, uneven chewing might point to dental pain, and a shift in bark tone can signal a mood change. Capturing and decoding these sounds helps pet parents catch early signs of discomfort. At Hoomanely, the goal is simple: help people understand dogs better, not by adding more microphones, but by adding intelligence to what those microphones already pick up. We're not just recording. We're interpreting.