Observation-First AI Infrastructure for LLM-Powered Systems
When an AI feature behaves well, it feels effortless: the user asks a question, the model replies, and everything just works. But under that smooth surface, LLM calls are some of the most complex operations in your stack, huge prompts, variable latency, opaque provider behavior, and costs that can drift quietly over time.
If you treat those calls like any other HTTP request, you end up guessing in production. Why did this response hallucinate? Why did latency spike for users in one region? Which feature suddenly doubled our token bill last week?
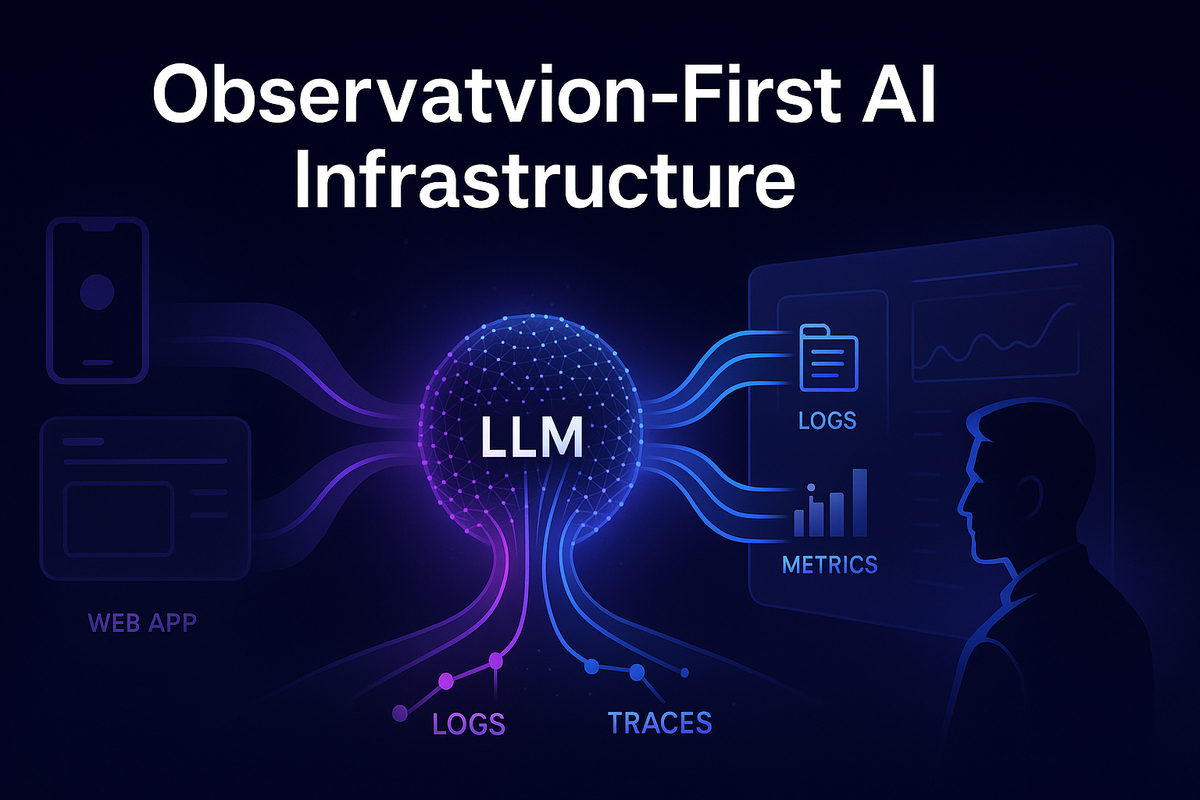
Observation-first AI infrastructure flips the default. Instead of sprinkling logs after something breaks, you design your gateway, metrics, and traces around the idea that every LLM call is a first-class, observable event. This post walks through how to do that: what to log, which metrics to track, how to tag traces, and how this plugs cleanly into a Python-based AI gateway, like the ones used at Hoomanely.
The problem: LLMs don't fail like normal APIs
Most teams already have "good enough" observability for REST APIs, HTTP status codes, latency histograms, basic error logs, APM traces for slow endpoints. For LLMs that's not enough. The painful issues almost never show up in a 500 status code.
Typical symptoms you can't see with vanilla observability include: the tone of responses changed after last week's deploy; the token bill went up threefold while traffic looks the same; one feature is slow, but only for some users and only at certain times; the model is suddenly misclassifying a pet's behavior after a prompt tweak. These are content- and context-driven failures. To debug them you need to connect three dimensions: what (feature name, model, prompt template, system instructions, guardrail rules), how (token counts, context size, latency, retries, streaming vs non-streaming), and who/where/when (tenant, app platform, region, version, time window). Standard API metrics give you only a thin slice of that. Observation-first infrastructure is about widening the lens.
Approach: make LLM calls first-class, observable events
An observation-first mindset starts with a simple rule: every LLM call is a domain event, not just an HTTP request. That means treating it like you would a payment, a ride booking, or an order, it has its own schema, a correlation ID shared across services, and you can inspect its lifecycle later, even months after the fact.
At minimum, each LLM call should produce one structured log event containing feature_name (which product feature triggered this), model (provider and version), tenant_id/user_id/session_id (hashed or pseudonymous as needed), request_id/trace_id (correlation IDs), prompt_template_id plus prompt_hash (which prompt variant was used), input_token_count and output_token_count, latency_ms (end-to-end and model-only), streaming versus non_streaming, cache_hit/cache_miss flags, cost_estimate, and status (success, provider_error, timeout, filtered_by_guardrail).
You don't need full prompt text or full response in 100% of logs, in fact for privacy and cost you often shouldn't. But you need enough structure to answer which features drive most of your cost, whether hallucinations spiked after switching prompts, and whether timeouts correlate with specific models or regions.
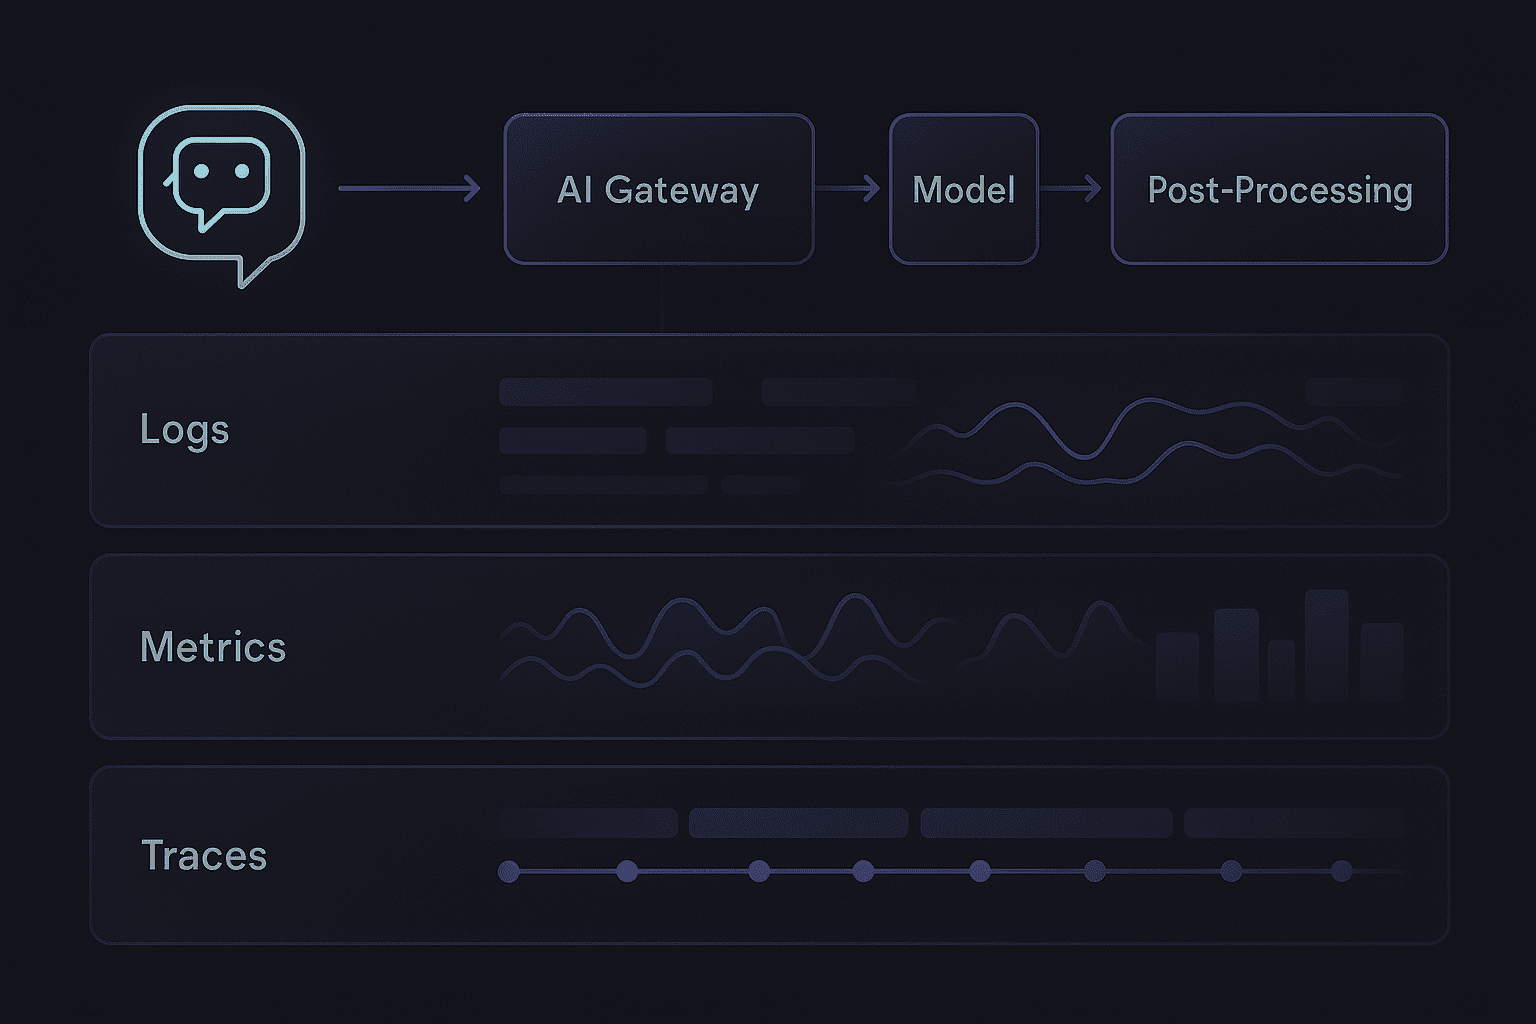
An observation-first design leans on all three signal types, logs for rich, queryable details per call (great for debugging weird behavior), metrics for fast, aggregated numbers (great for dashboards and alerts), and traces for end-to-end timelines across services (great for bottlenecks and context). The trick is emitting all three from the same event so they line up.
Designing LLM-specific logs
Here's a Python-style data model you might use inside your AI gateway:
from pydantic import BaseModel
from typing import Optional, Dict

class LLMCallLog(BaseModel):
    # Identity & linking
    request_id: str
    trace_id: str
    feature_name: str
    model: str

    # Context
    tenant_id: Optional[str]
    user_id_hash: Optional[str]
    session_id: Optional[str]
    platform: Optional[str]  # "ios", "android", "web"
    app_version: Optional[str]

    # Prompt & tokens
    prompt_template_id: Optional[str]
    prompt_hash: Optional[str]
    input_tokens: int
    output_tokens: int

    # Timing & behavior
    latency_ms: float
    streaming: bool
    retries: int
    cache_hit: bool

    # Outcome
    status: str           # "ok", "timeout", "provider_error", ...
    cost_usd: float
    extra: Dict[str, str] = {}
You can serialize this as JSON and send it to your log pipeline (OpenSearch, Loki, CloudWatch). A few important details: use prompt_hash instead of raw prompt, avoiding logging raw user prompts everywhere while still relating behavior to a prompt variant without leaking user text. Feature_name is non-negotiable, you never want to be stuck asking which part of the app an LLM call is for. And extra is a good spot for feature-specific fields like pet species or language.
Sometimes you still need content to debug behavior, like why a classification failed. You can log only the system prompt for a small sample of calls, log redacted snippets of user input, or enable a debug mode for specific test users or internal tenants. The observation-first approach says design this upfront instead of hacking print statements into random places.
Metrics: small, focused, and cost-aware
Logs give you depth, metrics give you speed and alerts. You don't want to expose all log fields as metric labels, that's a cardinality explosion waiting to happen. Instead choose a small, stable set of dimensions: feature_name, model, tenant_tier (free/pro/enterprise), and region.
Then define metrics that answer the important questions: traffic and success counts by feature/model/status, latency histograms by feature and model, input and output token totals by feature and model, and cost totals by feature, model, and tenant tier. You can then build dashboards like the top 5 features by monthly LLM cost, p95 latency per model and region, or token usage trend after a new feature launch. For alerting, think in user-impact terms, like p95 latency exceeding 4 seconds for chat-assistant for 15 minutes, cost per 1k requests doubling versus last week, or error rate exceeding 2% for a specific model. These are alerts your on-call engineer can actually act on.
Traces: seeing the whole journey, not just the model call
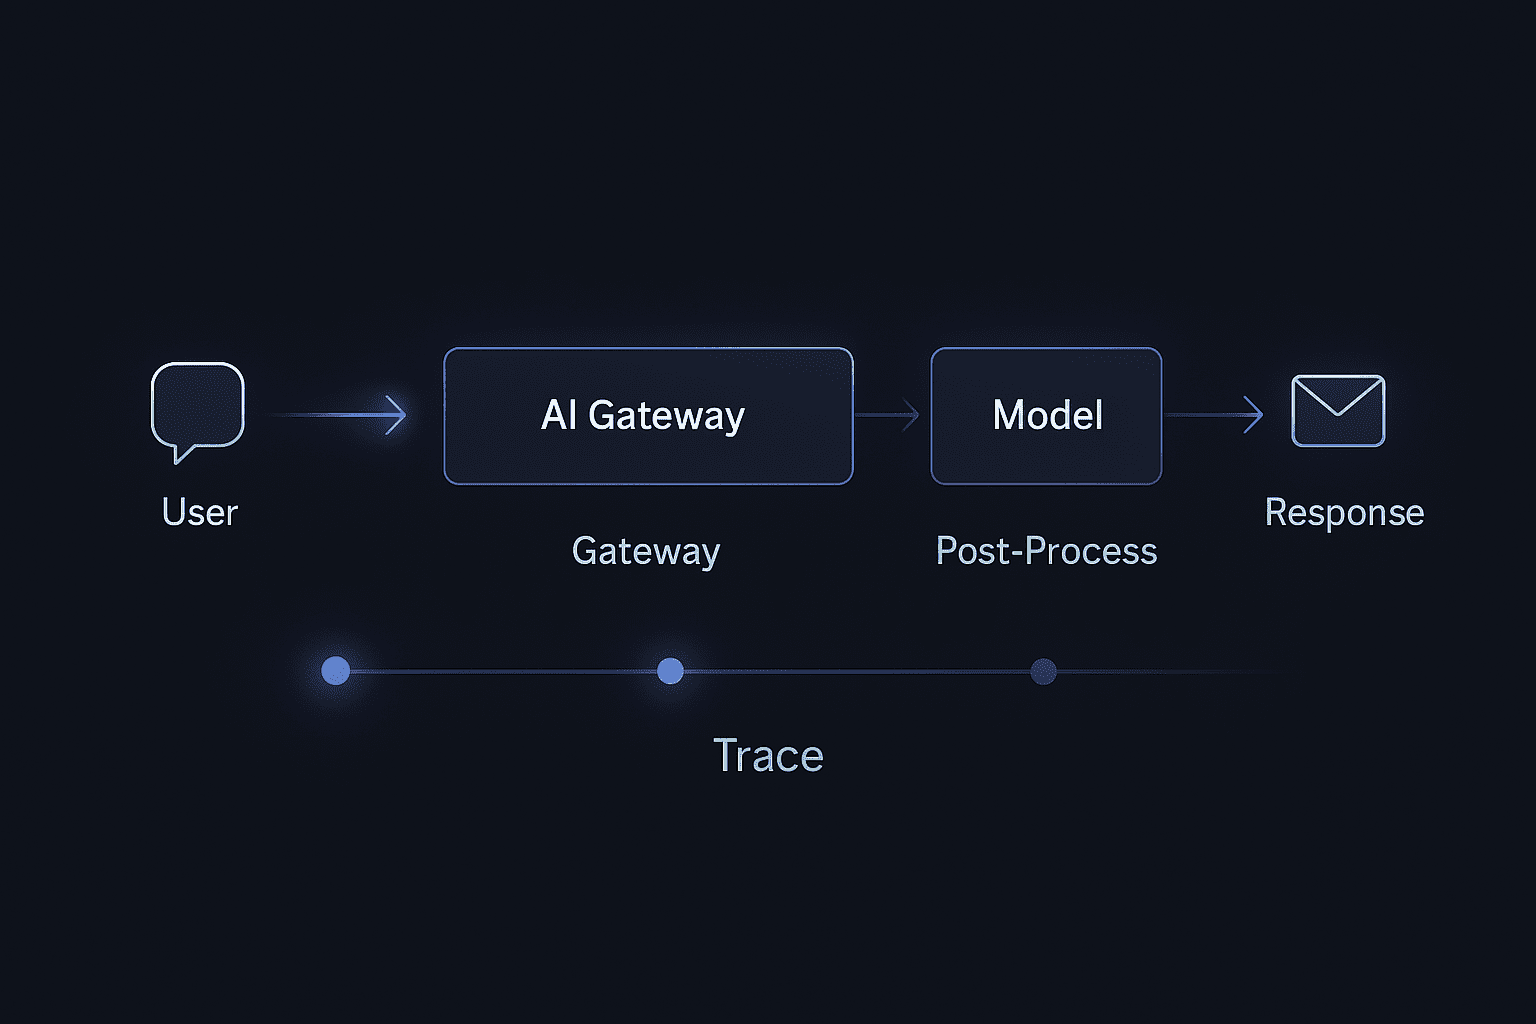
Traces connect your front-end experience with the model call and any downstream fan-out. For LLMs this is where you see where time is spent, prompt building, fetching context, model call, post-processing, whether your app is blocking on steps that could be parallelized or streamed, and how retry logic, fallbacks, or multi-model fan-out behave under load.
Imagine using OpenTelemetry with a Python AI gateway. A single user request might produce a trace with a top-level API span, then nested spans for build_prompt, retrieve_context, call_llm (with attributes for model, feature_name, input_tokens, output_tokens, latency_ms), postprocess_response, and push_events_to_analytics. The key idea: the LLM call is just one span in a bigger picture, but it's a well-tagged span. Useful trace attributes for the call_llm span include llm.feature_name, llm.model, llm.provider, llm.input_tokens/output_tokens, llm.cache_hit, and llm.status. With that you can ask to show traces where a given feature's duration exceeds 4 seconds, or where input tokens exceed 10k.
Plugging this into a Python AI gateway
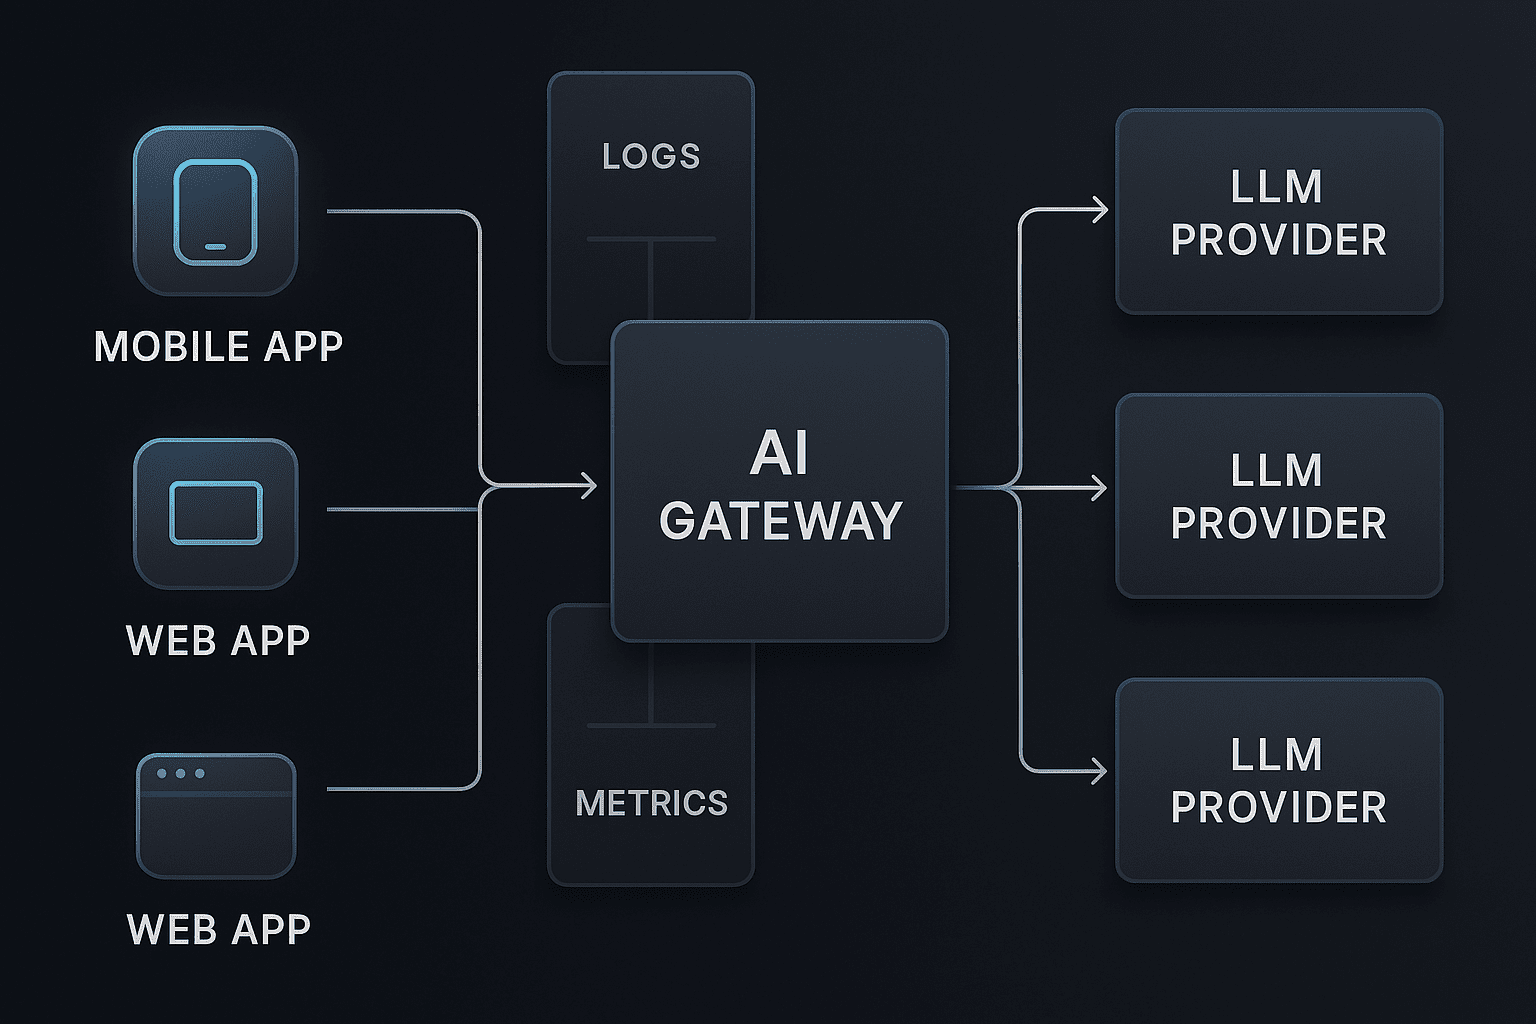
Most teams already have some kind of AI gateway, a Python service that receives requests from web/mobile backends, builds prompts and retrieves context, calls one or more LLMs, and post-processes and returns responses. Observation-first design says wrap every model call with a thin, reusable observability layer. Conceptually you want something like:
import time
from contextlib import asynccontextmanager

@asynccontextmanager
async def observe_llm_call(feature_name: str, model: str, **context):
    start = time.perf_counter()
    error = None
    result = None
    try:
        yield lambda r: setattr_nonlocal('result', r)  # pseudo-code hook
    except Exception as e:
        error = e
        raise
    finally:
        duration_ms = (time.perf_counter() - start) * 1000
        # Extract token counts and cost from `result` if available
        log_llm_call(
            feature_name=feature_name,
            model=model,
            duration_ms=duration_ms,
            error=error,
            context=context,
            result=result
        )
        record_llm_metrics(...)
        annotate_trace_span(...)
Your actual implementation will be more explicit, but the pattern is: start a timer and trace span, call the model, capture token counts and metadata, emit a structured log, and update metrics plus span attributes. In your handler:
async def run_nutrition_coach(query: str, pet_profile: dict, ctx: RequestContext):
    async with observe_llm_call(
        feature_name="nutrition-coach",
        model="bedrock.meta.llama3-8b",
        tenant_id=ctx.tenant_id,
        user_id_hash=ctx.user_hash,
        platform=ctx.platform,
    ) as set_result:
        prompt = build_prompt(query, pet_profile)
        response = await llm_client.chat(prompt)
        set_result(response)
        return postprocess(response)
The goal isn't to obsess over syntax, it's to centralize observability so every feature doesn't reinvent logging and metrics.
At Hoomanely, our mission is to help pet parents keep their companions healthier and happier through data, insight, and gentle nudges, not just raw charts. Our AI features sit on top of real sensor streams and behavior logs, interpreting what's happening and turning it into actionable guidance. Observation-first AI infrastructure is how we keep that guidance trustworthy. When a hydration insight for a dog using a smart bowl looks off, we can quickly trace whether the context retrieval pulled stale weight data, the LLM call hit an overloaded model, or a new prompt variant changed tone or thresholds. For activity summaries derived from wearable streams, we can see whether token counts spiked due to overly verbose internal summaries, some tenants are experiencing timeouts in a specific region, or a new model increased cost per insight. By tagging LLM calls with feature names, sensor context markers, and tenant tiers, we can iterate on prompts and models without turning pet parents into beta testers.
Results: what changes when you go observation-first
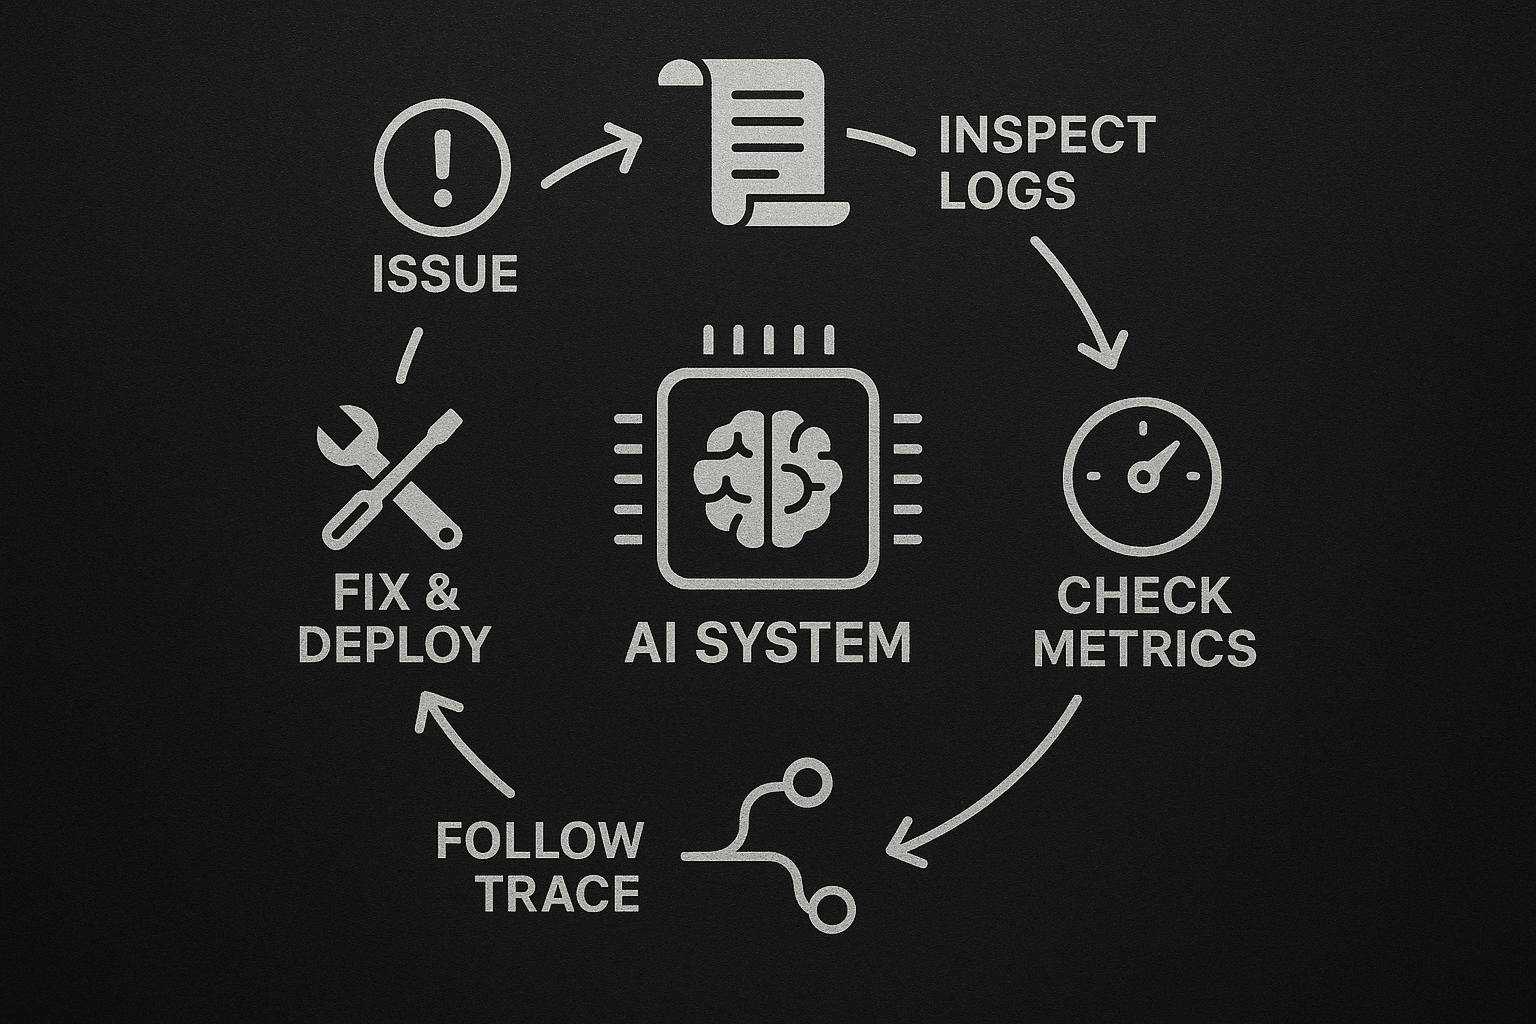
Debugging becomes explainable. Instead of "the AI feels weird today," you can say latency increased because input tokens jumped after adding two extra knowledge bases into RAG context, hallucinations clustered around a new prompt template introduced yesterday, or only Android users in region X see timeouts due to a gateway routing misconfig, not a model bug. You go from intuition and guesswork to structured hypotheses.
Cost stops being a surprise, because every LLM log has token counts and cost estimates, and metrics aggregate cost per feature and tenant tier, you can spot noisy features whose value doesn't justify their spend, tune output length and sampling parameters with real impact numbers, and run A/B tests on models tracking both quality and cost per 1k tokens. You can even set budgets, capping cost per day for a free-tier feature and then degrading gracefully.
Experimentation gets safer. It becomes much safer to try a new model version for 10% of traffic with a feature flag, or introduce a new prompt template and compare latency, tokens, cost, and user-facing errors. When something goes wrong you can roll back based on measured regressions, not vague impressions.
A practical checklist for observation-first LLM systems
For schema and IDs, define a canonical LLM call schema with fields for feature, model, tokens, latency, cost, and status; ensure every user request has a correlation ID flowing from app through gateway through AI gateway through provider; and introduce feature_name and prompt_template_id as first-class concepts in your code. For logging, emit one structured JSON log per LLM call using the canonical schema; add prompt_hash instead of raw prompt text for most calls, only logging redacted content for sampled debug traffic; and include tenant tier, platform, and app version for debugging environment-specific issues.
For metrics, create metrics for request totals, latency histograms, token totals, and cost totals; limit labels to feature_name, model, tenant_tier, and region; and add alerts for latency degradation, error rate spikes, and cost deviation. For traces, instrument spans for build_prompt, retrieve_context, call_llm, and postprocess_response; attach LLM-specific attributes to the call_llm span; and verify traces from front-end requests clearly show where LLM time is spent. For governance and privacy, establish a policy for what content can be logged, periodically review logs and dashboards for accidental leakage of sensitive data, and document how to enable debug mode for internal users safely.
Key takeaways
Observation-first AI infrastructure is less about fancy tools and more about discipline: treat every LLM call as a domain event with a clear schema, emit structured logs, focused metrics, and well-tagged traces from a single point in your AI gateway, and use those signals to debug behavior, control cost, and run safe experiments as your AI surface area grows. For teams building AI features across mobile and web apps, this approach turns LLMs from mysterious black boxes into inspectable, controllable, and evolvable components of your system. You'll still need good prompts, robust data, and thoughtful UX, but with observation-first infrastructure you'll at least know why things behave the way they do and what to adjust next.