Real‑Time Telemetry Charts
Real-time telemetry is the heartbeat of connected products. When the stream looks smooth, teams ship with confidence, when it stutters, trust erodes fast. The silent killers aren't exotic algorithms, they're everyday mistakes: rendering on every message, letting arrays grow forever, and forgetting to tear down listeners during page changes.
In device ecosystems like smart feeders and wearable trackers, traffic bursts, reconnect storms, and brief offline windows are normal. Your charts must stay predictable, flat memory profile, steady frames, graceful behavior when history floods in after a reconnect. This post condenses practical patterns that hold up for hours-long sessions: a single MQTT-over-WebSocket client per tab, reference-counted subscriptions, bounded ring buffers, time-based batching, stable chart instances, and pragmatic backpressure.
Why real-time charts leak
Unbounded series mean appending forever kills memory, then FPS. Dangling listeners mean remounts add MQTT callbacks you never remove. Object churn, recreating chart instances or datasets per frame, forces GC. Per-message paints mean bursts translate to hundreds of layouts per second. Wildcard sprawl means too many topics with no accounting and surprise handlers. And reconnect floods happen when devices dump buffered history and the UI tries to draw all of it. Symptoms include a creeping heap, jank after 10-30 minutes, and "works locally but fails in demos."
Approach: guardrails that always pay off
One connection per tab, anchored to the page or app shell. Reference-counted subscriptions, subscribe once, unsubscribe at zero. Bounded ring buffers, keeping the last 60-120 seconds of data. Coalesced updates, batching messages and painting at a steady cadence. A stable chart instance, mutating data arrays rather than recreating objects. Backpressure and decimation when backlog spikes on reconnect. And a single cleanup path that clears sockets, listeners, intervals, and animation frames.
Building it: a single shared MQTT client
// subscribe(topic, cb) -> () => unsubscribe()
const refs = new Map<string, Set<Function>>();
function subscribe(topic, cb){
  if(!refs.has(topic)){ refs.set(topic,new Set()); client.subscribe(topic); }
  refs.get(topic)!.add(cb);
  return ()=>{ const s=refs.get(topic)!; s.delete(cb); if(!s.size){ refs.delete(topic); client.unsubscribe(topic); } };
}
This prevents duplicate sockets and orphaned handlers.
Bounded series with a ring buffer
function rbuf(N){ const a=new Array(N); let h=0,len=0; return{
  push:v=>{ a[(h+len)%N]=v; len<N?len++:h=(h+1)%N },
  snapshot:()=>Array.from({length:len},(_,i)=>a[(h+i)%N])
};}
Memory is capped by design, writes are O(1), and behavior is predictable.
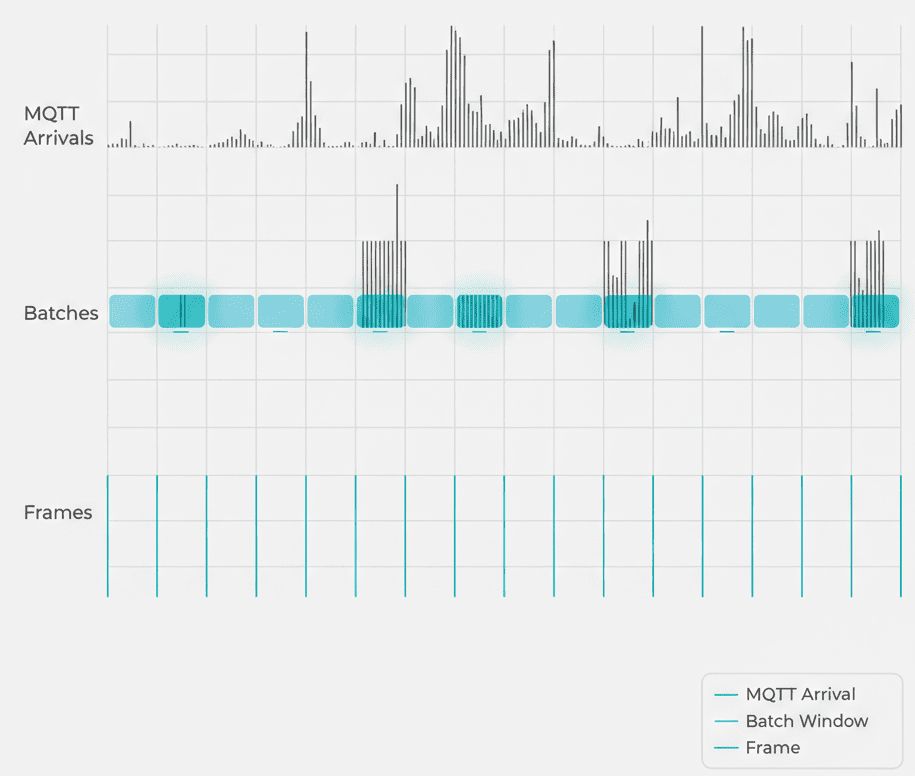
Batch messages, paint on time not on event
const buf=rbuf(3600); let batch=[];
onMqtt(p=>batch.push(p));
setInterval(()=>{ const L=1000; (batch.length>L?batch.slice(-L):batch).forEach(buf.push); batch.length=0; },50);
(function draw(){ chart.setData(buf.snapshot()); chart.update(); requestAnimationFrame(draw); })();
This gives smooth frame pacing and protects the main thread during bursts.
Stable chart instance
Create the chart once per canvas, reuse datasets and arrays. Mutate data in place, avoiding re-allocated objects per frame. Disable heavy animations for live traces. And prefer typed arrays if supported.
Backpressure and decimation
Use a drop policy, clamping the batch to the last K points per tick, say 1000. Use per-pixel decimation, capping points at chart width. And use adaptive throttle, temporarily increasing the batch interval from 50ms to 150ms until backlog clears.
Visibility and power
Pause batching and animation frames when the tab is hidden, resuming on focus. Keep buffering lightweight if you must retain last-known points.
One teardown to rule them all
On page unmount, unsubscribe all topics, clear intervals, cancel animation frames, destroy the chart, and close the socket when the app exits. Verify via heap snapshots that no live listeners or timers remain.
Results: what "good" looks like
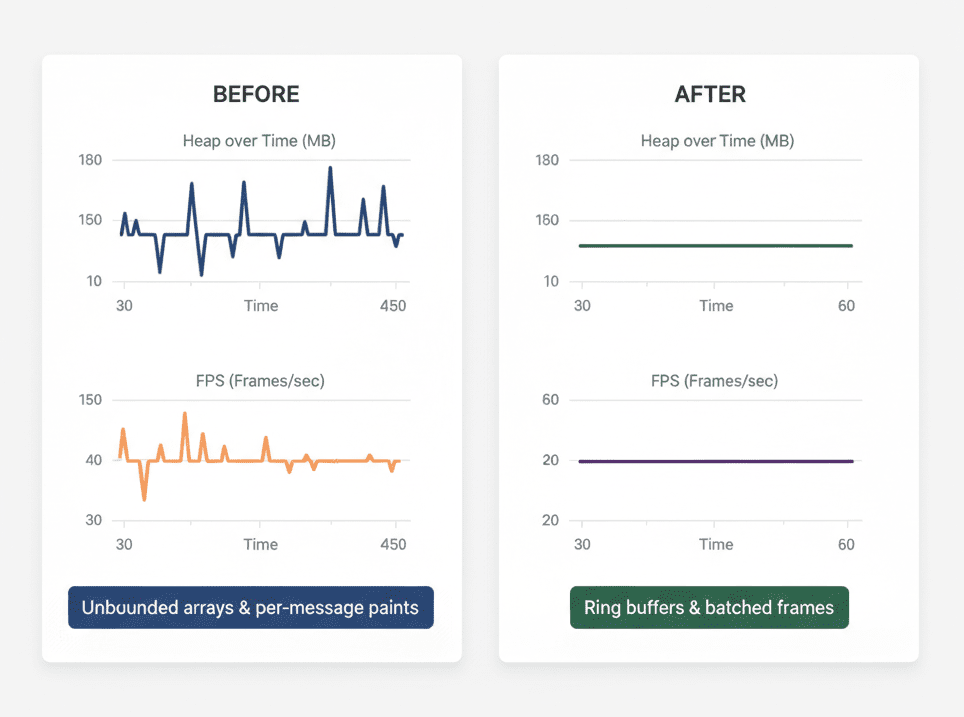
Heap stays flat, within about 5%, during multi-hour runs. FPS holds around 55-60 on modest laptops under 50-100Hz streams. Reconnect storms don't stall the page, backlog drains via batching and decimation. And zero residue remains after navigation, listener counts, intervals, and animation frames return to baseline.
Common issues and quick fixes
If the chart slows over time you're likely replacing dataset objects, mutate arrays in place instead. Memory creep means arrays aren't capped, convert to ring buffers. Duplicate points after reconnect mean you need to track the last timestamp per topic and drop anything at or before it. High CPU when the tab is hidden means pause the animation frame loop and batching on document.hidden. Unsubscribe no-ops mean implement reference counts and unsubscribe when the set size hits zero. And "works locally, fails live" usually means bursts exceed per-frame capacity, enable decimation or a drop policy.
Performance budgets
A 60-120 second live view window is enough for "now." Cap max points per frame at roughly the chart width in pixels, say 1200. Use a batch interval of 33-67ms, 30-60Hz, for perceptual smoothness. And cap reconnect backlog at something like 50k per series, plus decimation.
How it works
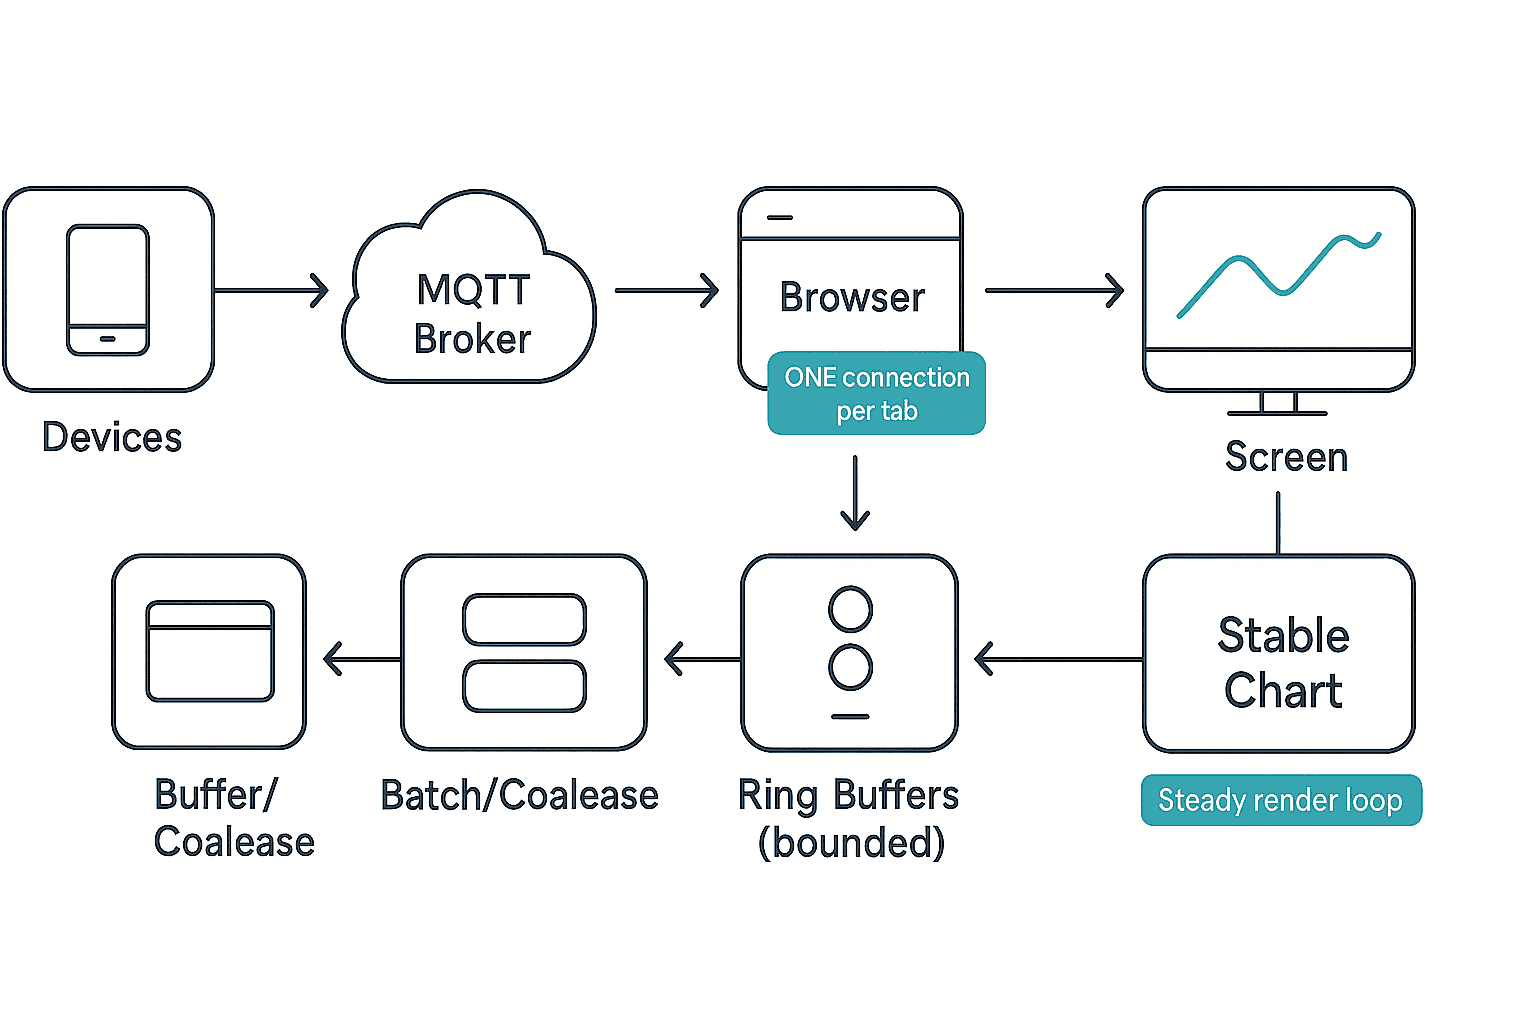
Data flows from devices publishing light telemetry messages through an MQTT broker, consumed by the browser via a single WebSocket client, staged into short-lived batches, drained into bounded ring buffers, and painted on a time-driven loop rather than per message.
This holds up under load because of temporal decoupling, message rate doesn't equal paint rate so spikes don't force repaints, spatial bounds via ring buffers set an upper limit on retained points so memory can't drift, and lifecycle hygiene via one client, reference-counted topics, and one teardown means zero orphaned listeners. During reconnect storms, backlog arrives quickly and you decimate or drop to protect the UI, batch intervals may widen briefly until queues calm down, and the chart's visual window stays consistent, reinforcing user trust.
Client architecture blueprint
Use clear roles: the transport (MQTT WS client) owns the connection, exponential backoff, and topic subscription ref-counts, exposing a typed event-like API and a single dispose() for teardown. The stream coordinator translates raw messages into normalized points, enforces payload sanity, and routes to series by key. The series store (ring buffers) enforces capacity per visible line and offers a snapshot for drawing. The scheduler runs two clocks, a batch clock draining messages every 33-67ms, and a frame clock painting via requestAnimationFrame, suspending both when the tab is hidden. And the chart adapter is a thin layer to your charting library that never recreates the chart instance, mutates arrays in place, and toggles decimation if available.
Server-side guardrails
Even a perfect client suffers without a healthy broker and topic design. Prefer stable, minimally wild topics like devices/{id}/telemetry/{signal}, avoiding over-broad wildcards in the UI. Use retained messages sparingly, only for a small last-known snapshot so fresh charts render immediately. If you support backfill, segment by time and cap returned points so the browser can decimate locally. Choose a QoS level fitting your network and duplication tolerance, QoS 0/1 often suffices for live charts. And lock topics with ACLs, never exposing raw wildcards to the browser.
Payload design for efficient charts
Aim for compact, parseable, and monotonic fields: t (epoch ms), y (number), optional q (quality/flags), seq (monotonic counter), and tag (short string). Avoid bulky JSON per point for high-rate streams, batch points server-side into small arrays with a shared base timestamp. And normalize t on the client if device clocks vary, since relative time within the window is what matters for the chart.
Multi-series and multi-device views
Only render what's visible, suspending frame updates for off-screen or collapsed series while keeping a tiny buffer for the last-known value. Cap total points across all series to roughly the chart width in pixels. And convert hidden series into numerical badges, last value and delta, so accessibility and at-a-glance use stay strong without costing FPS.
Downsampling strategies
Per-pixel cap is fast and simple, at most one point per pixel column preserving spikes. Largest-Triangle-Three-Buckets gives better shape preservation for historical windows, using it only when rendering past data. Quantile bins for very bursty signals keep min/median/max per bucket, drawn as thin whiskers with a median trace. For a live 60-120 second window, per-pixel cap is typically enough and cheapest.
Instrumentation and observability
Measure continuously: heap estimate plotted alongside FPS, frame time percentiles (keeping P95 under 16.7ms for a 60Hz feel), batch size distribution as an early indicator of storm handling, dropped or decimated point counters with alerts if ratios exceed a threshold, and listener counts periodically asserting zero residual listeners for disposed pages. Show a small "Live: Good / Catching Up / Degraded" pill derived from these metrics, setting the right expectation for users during storms.
Failure modes and recovery patterns
On a frozen chart after tab sleep, discard stale batches on wake and resume from live time, don't replay stale windows if your promise is real-time. For duplicate data after reconnect, track last-seen timestamp or sequence per topic and drop anything at or before it. For broker throttling, surface a gentle UI hint while keeping interaction snappy. And for clock jumps from device resets, detect backward time leaps and start a new segment with a subtle visual break.
Security, privacy, and resilience
Use least privilege, browser credentials scoped to read-only, narrow topic sets. Minimize PII, avoid embedding user identifiers in topic names, use opaque IDs. Harden transport with secure WebSockets/TLS and short-lived, rotating tokens. Fail gracefully on auth failure by rendering the last-known value plus a diagnostic, not a blank page. And define error budgets, like P95 data delay under 200ms, designing backpressure to respect it.
A mini case study
We integrated these patterns into a device dashboard with multiple concurrent signals, weight, temperature, motion. Initial issues, memory creep after about 25 minutes and frame drops during reconnect storms, traced back to per-message paints and unbounded arrays. Switching to a single WS client, ring buffers with a 90-second window, 50ms batch ticks, and per-pixel decimation turned the experience around: flat heap, steady 57-60 FPS, and predictable behavior during history dumps. The most impactful fix was mutating dataset arrays in place, removing hidden object churn that GC struggled to keep up with.
At Hoomanely, our mission is helping pet families keep their companions healthier and happier through thoughtful technology. Leak-free, real-time telemetry is the bridge from raw sensor signals to humane, trustworthy insights. Calm, reliable charts build confidence, so alerts are believed, trends are acted on, and care improves.
Key takeaways
Lifecycle first, one connection per tab, one teardown path. Bounded by design, ring buffers plus per-pixel caps keep memory flat. Paint on a clock, batching irregular arrivals and rendering at a steady cadence. Reuse, don't rebuild, mutating datasets to avoid object churn. Plan for storms, decimating or dropping when reconnects flood the pipe. And measure it, heap plus FPS plus dropped ratios, shipping with budgets and tests.