Crashlytics and How It Affects App Performance
No matter how polished your app's UI is, a single crash can shatter user trust instantly. Users don't file bug reports, they uninstall.
That's where Firebase Crashlytics comes in. It's more than a crash reporter, it's a real-time, intelligent insight system that helps you understand why your app crashed, where it happened, and how to fix it quickly. Does Crashlytics itself affect app performance? Let's look at the reality behind that question.
The problem: unseen crashes, lost users
Once an app ships to production, visibility becomes your biggest challenge. Crashes can arise from unhandled exceptions, memory leaks, device-specific configuration issues, race conditions in async operations, and poor network handling. The important questions, which users crashed (device model, OS version, network conditions), what triggered it (a specific action, an edge case, a race condition), and how often it happens (isolated or widespread), are hard to answer with traditional logging. You might see an exception in your local console, but once the app is in users' hands, those errors often disappear into the void. Without that context, you end up fixing symptoms, not root causes.
What Crashlytics is
Firebase Crashlytics, part of Google's Firebase suite, closes that visibility gap by automatically capturing crashes and exceptions with context-rich logs, grouped by similarity and delivered in real time. It hooks into your app's exception handlers to capture fatal crashes (app termination), non-fatal exceptions (caught errors you want tracked), and ANRs (Application Not Responding, Android only).
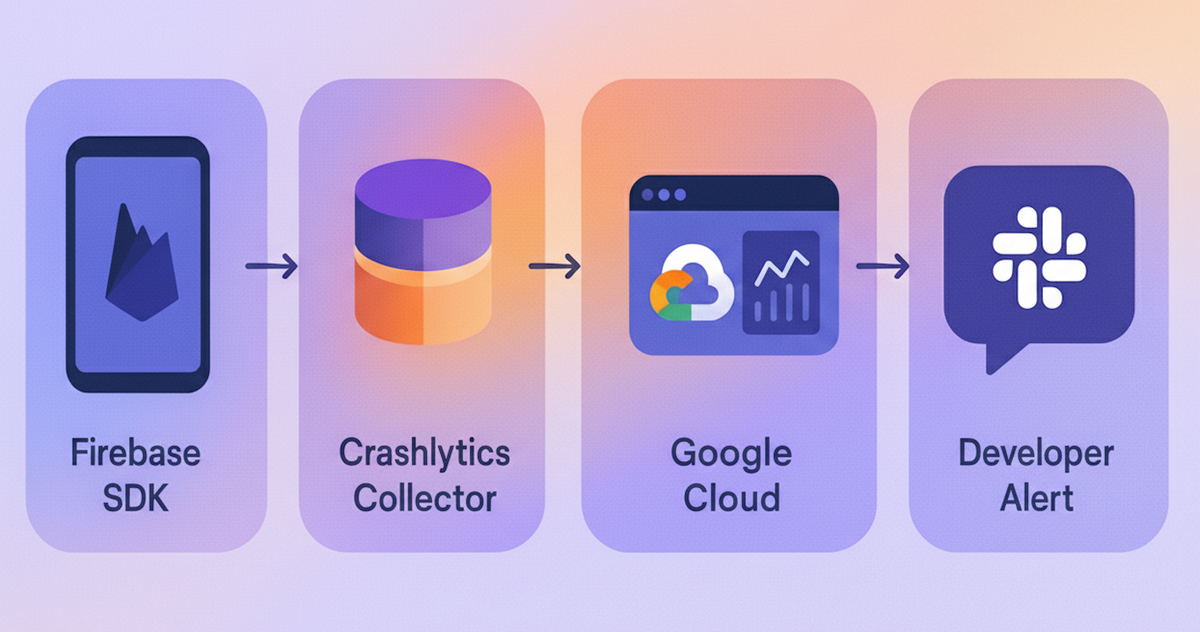
When a crash occurs, it gets detected, its stack trace captured, stored locally, uploaded on the next app start, symbolicated on the server, and shown in the dashboard in real time. The key insight is that crash data gets written to disk immediately but uploaded asynchronously on the next session, so network calls never block the crashed app.
Behind the scenes of Crashlytics
Crashlytics uses a lightweight, asynchronous process to collect crash data. When an exception occurs, it hooks into the error handler, caches the crash data locally under the app's private storage, and uploads the report to Firebase servers on the next app start. That whole sequence happens off the main UI thread, so there's no noticeable lag.
By design, Crashlytics is low-latency (under 1-2ms impact during runtime), memory-safe (minimal heap allocation), and network-efficient (batch uploads only after a crash or restart). A common misconception is that it's constantly listening or transmitting in real time, in reality it's event-driven, only waking up when something actually goes wrong.
Manual exception tracking
For caught exceptions you want visibility into:
try {
  await riskyNetworkCall();
} catch (e, stackTrace) {
  // Log context before recording
  FirebaseCrashlytics.instance.setCustomKey('user_action', 'checkout');
  FirebaseCrashlytics.instance.setCustomKey('cart_items', cartCount);

  FirebaseCrashlytics.instance.recordError(
    e,
    stackTrace,
    reason: 'Payment processing failed',
    fatal: false
  );
}
Performance impact: the numbers
| Metric | Impact | Details |
|---|---|---|
| APK/IPA size | +200-400 KB | Compressed SDK size |
| Memory | ~2-5 MB | Runtime allocation |
| CPU | <0.5% | Background thread processing |
| Battery | Negligible | Network uploads only on WiFi by default |
| Startup time | +10-20ms | One-time initialization |
What actually causes performance issues is bad practice, not the SDK itself. Logging in tight loops (calling FirebaseCrashlytics.instance.log() for every item in a large list) blocks the main thread, as does setting excessive custom keys per session. The optimized approach is to batch logs strategically, joining item IDs into a single summary string instead of logging each one, and using a small, stable set of meaningful custom keys like "screen" or "user_type."
Platform-specific setup
On iOS, crash logs start out unsymbolicated, just raw memory addresses. Decoding them into readable stack traces needs dSYM (Debug Symbol) files from your Xcode build. Manual upload uses the firebase crashlytics:symbols:upload CLI command, automated upload happens through an Xcode build phase script, and CI/CD integration is straightforward with Fastlane's upload_symbols_to_crashlytics lane. The result: a raw address like 0x10a1b2c3d becomes something like "PetDetailViewController.swift:87, null pointer in loadImage()."
On Android, Flutter's Firebase plugin auto-uploads ProGuard/R8 mapping files during flutter build apk --release if it's configured correctly, which you can verify in android/app/build.gradle by checking that mappingFileUploadEnabled is set to true.
Common mistakes that break crash reporting
Forgetting to test in release mode, since debug builds behave differently, always run flutter run --release before shipping. Catching all exceptions without recording them, silently printing an error to console loses it forever instead of tracking it through recordError(). Not setting user identifiers after login, which means you can't filter crashes by user in the console. And ignoring the crash-free users metric, which is really the only number that matters for store visibility.
Notifications for regressions
Crashlytics integrates with tools like Slack, so the team stays informed without constantly checking the Firebase console. You can configure alert thresholds, for example triggering a Slack message when crash-free sessions drop below 98%, or when a specific issue spikes past a set volume. That makes monitoring proactive instead of reactive, so the team responds before users even notice.
Real-world impact: Hoomanely case study
After integrating Crashlytics with proper symbolication, our crash detection time dropped significantly thanks to immediate real-time alerts, and debug time per crash fell substantially since reports now come with full context. Our app uses Crashlytics as part of a broader observability stack that also includes PostHog for behavior analytics and AWS CloudWatch for infrastructure health. Every crash report helps us deliver smoother, more reliable experiences for pet parents and their companions.
Checklist: production-ready Crashlytics
- Crashlytics enabled in release builds
- dSYM/mapping files uploaded automatically
- User identifiers set post-authentication
- Custom keys limited to under 10 per session
- Non-fatal exceptions logged for critical paths
- Team alerts configured for crash rate thresholds
- Crash-free users metric monitored weekly
- Stack traces are readable, with no obfuscated or missing symbols
Key takeaways
Crashlytics adds under 20ms to startup with negligible runtime overhead. Bad logging practices cause performance issues, not the SDK itself. Symbolication is critical, automate dSYM and mapping uploads. Crash-free users is the goal for store visibility. And combining Crashlytics with behavior analytics gives full observability. Stable apps don't just perform better, they build trust, and in competitive app markets, trust is your moat.