How We Improved Core Web Vitals in Next.js: Insights from Real Performance Experiments
Performance is often associated with page speed. While loading speed is an important part of the user experience, it isn't the whole story. A page may load quickly yet still feel frustrating if elements shift unexpectedly or interactions are delayed. Exploring a Next.js application that appeared fast on paper but felt less responsive in practice highlighted that performance is ultimately a combination of speed, stability, and responsiveness.
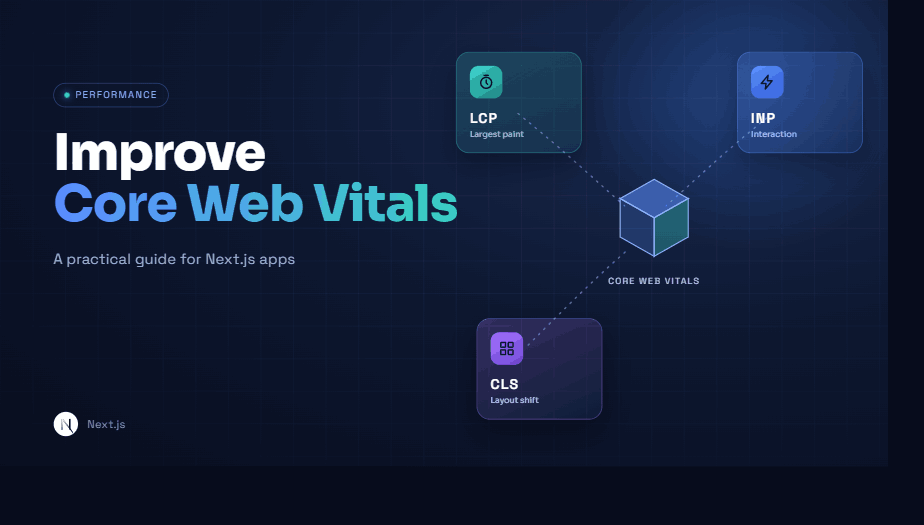
That's what led to Core Web Vitals Largest Contentful Paint, Interaction to Next Paint, and Cumulative Layout Shift. Rather than treating them as SEO boxes to tick, the goal was understanding what each one was actually pointing to, and how Next.js could help close those gaps. Here's what came out of that.
The moment loading speed stopped being the whole story
The first thing worth digging into was how quickly visitors could see something meaningful on the page. Hero images turned out to be the biggest culprit. They're usually the largest element rendered above the fold, so they end up dictating LCP whether you plan for it or not.
Plain <img> tags had been the default out of habit, and switching to Next.js's next/image component made a bigger difference than expected. Responsive sizing, lazy loading, and automatic conversion to formats like WebP and AVIF cut down the data going over the wire without any manual optimization work. Prioritizing the hero image also let the browser fetch the important content sooner, changing how "fast" the page felt even before every byte arrived.
To sanity-check this before writing it up, the same routes were run through Lighthouse and WebPageTest before and after swapping in next/image. Across repeated runs the pattern held steady: the performance score climbed and the LCP marker consistently landed earlier in the load timeline, without touching anything else on the page.
// Before: plain img tag, no sizing hints, no format negotiation
<img src="/hero.jpg" alt="Hero banner" />

// After: next/image with priority + explicit dimensions
import Image from 'next/image'

<Image
  src="/hero.jpg"
  alt="Hero banner"
  width={1600}
  height={900}
  priority
  sizes="100vw"
/>
Chasing down the layout shifts that were quietly annoying users
Cumulative Layout Shift turned out to be the most surprising one. A fast-loading page isn't automatically a good page. Content jumping around while someone's reading or about to click something is exactly the kind of thing that erodes trust in a site, even when no one can quite articulate why.
Most of the shifting traced back to media that didn't reserve space before loading. Without predefined dimensions, the browser has no choice but to recalculate the layout the instant an image appears. Giving next/image explicit dimensions fixed most of this by reserving the space upfront.
Fonts were the other unexpected culprit. When a custom font swaps in after the initial render, text can visibly shift position; next/font quietly solves this by handling font loading and fallback behaviour more intelligently.
The CLS number backed this up too: watching the same pages in the Lighthouse report and in Chrome DevTools' Performance panel, the layout-shift markers around the hero image and headline text dropped out almost entirely once dimensions and next/font were in place, run after run.
// Before: font linked via a stylesheet, swaps in after initial render
// (classic source of a font-related layout shift)

// After: next/font self-hosts and preloads the font, no shift on swap
import { Inter } from 'next/font/google'

const inter = Inter({
  subsets: ['latin'],
  display: 'swap',
})

export default function RootLayout({ children }) {
  return (
    <html lang="en" className={inter.className}>
      <body>{children}</body>
    </html>
  )
}
Realizing this isn't a one-time audit
Somewhere along the way, Core Web Vitals stopped feeling like a single Lighthouse score to fix and move on from. Lighthouse and Page Speed Insights are great for a quick lab check, but they're a snapshot. They don't show how real visitors experience a site over time. Real-user monitoring, like Vercel's Web Vitals reporting, changes that picture entirely: it points to the bottleneck that's actually hurting real users, and that isn't always the one a test environment flags.
What stuck after all this
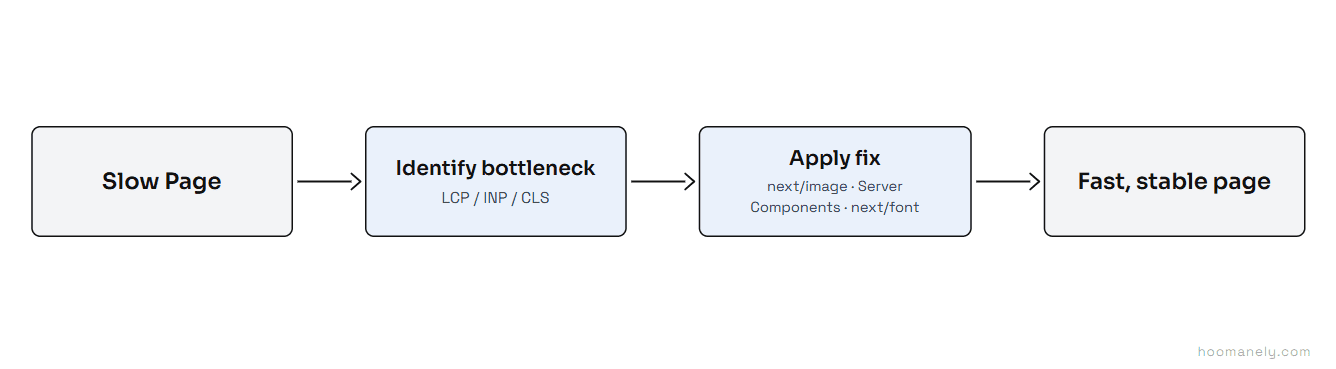
The short version: next/image handles most of the LCP heavy lifting, but prioritizing hero content and trimming server response time (edge rendering or ISR help here) still matters. Code-splitting and leaning on Server Components keeps INP in check by shipping less JavaScript for the browser to churn through. And CLS mostly comes down to respecting space, for images, embeds, and fonts alike.
The INP piece was easy to underestimate until it was measured directly. Profiling a few of the heavier interactive routes in Chrome DevTools showed long tasks stacking up from components that didn't need to be in the initial bundle at all. Lazily loading them and pushing more rendering to Server Components brought those long tasks down and made the same interactions feel noticeably snappier in repeated testing.
This never turned into a one-and-done fix, and honestly, I don't think it ever does for anyone. Core Web Vitals stopped being a checklist and turned into a habit: measure, find the real bottleneck, fix it, repeat. Some weeks that means chasing LCP, other weeks it's an INP regression or a stray CLS jump from a new embed. Whatever it is, every small fix adds up, and Next.js makes most of them easier to act on once you know where to look.
This has basically turned into a house rule: keep measuring, keep improving, and treat performance as something that grows with the product, not a box to check once. What actually matters is making fast, stable pages the default, consistently, over time. The best performance work is the kind nobody notices; it just quietly works.