Is It Rendering or Is It Data? Debugging a Stuck Onboarding Screen
The symptom
Pick a pet photo during onboarding, tap "Use this photo," and land on a scanning screen: "Taking a look at {pet}…" Most of the time it resolves in under a second. Sometimes — almost always on the very first attempt in a session — it just sits there. Forever. Go back, resubmit the exact same photo, and it works instantly.
That pattern points a finger before you've even opened a debugger. "First attempt only, works on retry" reads like a cold-start problem, and a scanning screen sitting on a photo reads like "the ML model isn't working." Both of those turned out to be reasonable places to look. Neither of them was where the bug lived.
What was actually wrong along the way
Four real bugs surfaced during the investigation. Each one was worth fixing on its own merits. None of them was the freeze everyone was chasing.
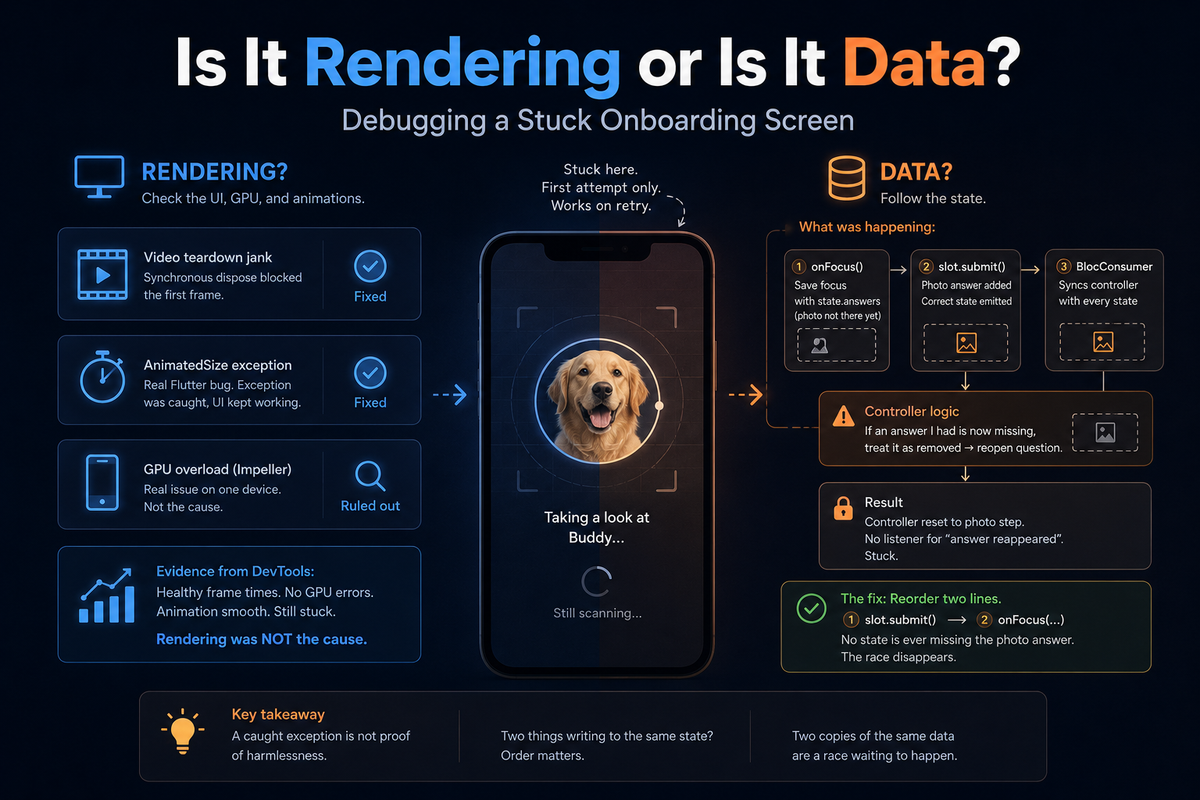
The sign-in video's teardown stealing the next screen's first frame. The sign-in screen plays a looping muted video. Navigate away and Flutter disposes that widget — and the old code tore down the native video codec synchronously, right there, on dispose(). On Android that's a real MediaCodec/ExoPlayer release, not a free operation. That teardown landed on the exact frame the new onboarding screen was trying to build and paint for the first time. On a weak device, the teardown was slow enough to starve it. Fixed by deferring dispose() to SchedulerBinding.instance.addPostFrameCallback, so the expensive cleanup runs after the current frame has already committed, not while it's still trying to.
A timeout measuring two different things. The breed-detection model loads once per session — a real, one-time cost. The code wrapped "run detection" in a 12-second timeout, sized for inference alone. On the first call in a session, those 12 seconds also had to cover the model's cold load, so a slow device could burn the whole budget before inference even started. Fixed by waiting for the model to report ready first, on its own 25-second timeout, before starting the 12-second inference clock. Cold load and inference stopped sharing a stopwatch that was only ever sized for one of them.
A background call that didn't check who it was running for. A best-effort "refresh cached onboarding questions" call fired even when nobody was signed in — true on the debug-only onboarding entry point, which deliberately skips real sign-in. The app has a global rule: any 401, from any call, means the session is dead, and it forces navigation back to sign-in. The global handler has no idea which call triggered it or how little anyone cared about its result. One unrelated background request was quietly bouncing the user out of the flow. Fixed by skipping the call entirely when there's no signed-in user.
A genuine Flutter framework bug that turned out not to matter. Two AnimatedSize widgets sharing a scrollable ancestor, both restarting their height animation in the same layout pass, tripped a real internal reentrancy exception. Staggering the changes across frames fixed the exception — but the first version of that fix accidentally removed the active step's widget from the tree for one frame, which reset its internal state and made the photo step forget it was mid-scan. That needed its own, narrower fix: stagger only the scroll list's active index, and let the actual question widget switch instantly so it's never removed from the tree at all. And after all that — the original exception was harmless. Flutter caught it, the UI kept working every time it was checked, and it had cost real investigation time as a convincing red herring.
A real GPU problem, also not the cause. On one specific budget Android device, Flutter's newer Impeller renderer was hitting a genuine graphics-pipeline overload — frames backing up, buffer acquisition failing. Worth knowing about. Ruled out, not fixed: relaunching with the older Skia backend made the GPU errors vanish and the animation visibly smooth — and the exact same freeze still happened. That's what proved rendering was never the cause.
The actual bug
Once rendering was fully ruled out — healthy frame times, no GPU errors, animation smooth, still stuck — the only place left to look was Dart-level logic. It was a race between two state emissions.
Submitting the photo called two things in this order: first onFocus(...), which saves the interview's current focus by emitting a new state built from state.answers — at that exact moment, before the photo answer exists in it. Then slot.submit(path), which is what actually adds the photo answer and emits the correct state that includes it.
A BlocConsumer elsewhere reacts to every emitted state by syncing an interview controller with state.answers. That controller has logic built to treat "an answer I already had locally is now missing" as "the user removed that answer — reopen the question." The first, incomplete state genuinely didn't have the photo answer, so the controller saw it vanish and reset itself to the photo step. The second, correct state arrived a moment later — but nothing was listening for an answer reappearing, only for one disappearing. So nothing undid the reset. The screen was stuck showing a step whose underlying data had already been correct since the previous state.
The fix was reordering two lines: submit the photo answer first, save focus second. By the time focus reads state.answers, the photo is already in it, so no emitted state is ever missing what it's about to have anyway. The race stops being possible, not just less likely.
Why this took five wrong turns to find
Every one of those four bugs was real and reproducible, which is exactly what made them dangerous leads. A caught exception that doesn't crash anything still feels like it must be doing something. A confirmed GPU bottleneck on the exact device you're testing on feels like it must be related. Neither claim holds up under evidence — it just holds up under plausibility, which is a much lower bar and the one bugs actually clear most of the time.
The turning point wasn't a smarter guess, it was a narrower question. "Is this rendering, or is this data?" is answerable with hard evidence — DevTools' Performance tab, frame times, GPU errors present or absent — in a way that "why is this stuck" is not. Once rendering was conclusively eliminated with evidence instead of suspicion, the search space stopped being "could be anything" and became "must be somewhere in maybe a dozen lines of Dart," and tracing the two calls that could write to the same state in either order found it directly.
Key takeaways
A caught exception is not proof of harmlessness. Flutter swallowed the AnimatedSize reentrancy error and the UI kept running every single time — and it was still worth fixing, and still not the bug being searched for. "It didn't crash" and "it isn't the cause" are two separate claims, and only evidence can tell you if both are true at once.
emit() is synchronous for the field, asynchronous for listeners — and listeners see every intermediate state, not just the one you meant to matter. Any time two things can write to shared state, ask whether swapping their order would change anything. If yes, you have this exact class of bug waiting to happen, not just a stylistic ordering choice.
Two copies of the same data kept in sync through a controller is a shape, not a coincidence, and it's a shape worth being suspicious of on sight. Wherever it shows up again, a stale-snapshot race is a real risk sitting in the design, not a one-off mistake in this one screen.
Author's note
The line I keep coming back to is the one in the writeup that separates "the data is wrong" from "the screen doesn't show the right data." From outside, a frozen screen looks like exactly one problem. It's at least two, and they need completely different tools to even see, let alone fix — one lives in DevTools' frame chart, the other lives in tracing two lines of a ViewModel against each other. Knowing which one you're looking at, before you start looking, would have saved more time here than any single fix did.