Mastering Debugging & Performance in Flutter Apps
Introduction
Debugging Flutter apps can feel deceptively complex. The framework promises smooth 60-120 FPS animations and native-like performance, yet in production, hidden issues emerge: rebuild storms, choppy scrolls, network delays freezing the UI, memory spikes, and elusive bugs buried in ViewModels. This guide is a practical, repeatable approach for identifying and solving errors in Flutter apps.
Understanding common Flutter problems
Real-world apps face subtle issues that only emerge under production load. Understanding these categories helps developers diagnose systematically instead of chasing symptoms.
UI jank and frame drops happen when frames take longer than 16ms to render (for 60 FPS) or 8.3ms (for 120 FPS), causing visible stutter. Common causes: widgets rebuilding too frequently, heavy animations causing layout recalculations, large images decoding on the main thread, complex ListView or Grid children rebuilt on scroll, and charts recalculating every frame without throttling.
Silent errors and hard-to-reproduce crashes are the hardest to catch, surfacing randomly, often only on specific devices or after prolonged use, and staying invisible in debug mode. They tend to show up on low-end devices with limited memory, after 30-40 minutes of continuous use, during garbage collection under memory pressure, or when ViewModels outlive their intended lifecycle. Root causes usually include missing await statements causing unhandled exceptions, multiple subscriptions to Streams or ChangeNotifiers, ViewModels not disposed correctly, or accessing disposed controllers. Defense: use structured logging (DevTools, Sentry), implement lifecycle tracing, and ensure consistent cleanup with dispose(), cancel(), and close().
Network and API stalls often show up as UI freezes when the main thread blocks on pending operations, whether from slow APIs increasing spinner duration, pagination logic mismanaging tokens or offsets, offline mode triggering retry loops without backoff, or multiple ViewModels calling the same endpoint. Solutions: debounce API calls, implement caching (Isar/Hive), profile with alice, and decouple background fetching from UI updates.
Memory and CPU spikes show up when resources aren't managed properly, memory rising with each rebuild or navigation until FPS drops or the OS kills the app. Common sources: full-resolution images rendered inline, deep widget trees with many layers, large JSON operations on the main thread, and dozens of active listeners or animations. Prevention: move heavy work to isolates, implement memory-aware caching, dispose resources proactively, and watch the DevTools Memory tab for "memory drift."
Release-only bugs are the most frustrating category, bugs that only appear in profile or release mode due to Flutter's different build pipelines: debug uses a JIT engine with loose optimizations, profile approximates release performance with instrumentation, and release uses AOT compilation with different shader and asset handling. Animations, image loads, or shaders may break only in release builds, especially without shader warm-up or when code assumes debug frame rates. Prevention: test in profile and release modes, monitor with Crashlytics or PostHog, and test on mid-range devices.
The core toolkit: Flutter DevTools
Flutter DevTools is your command center for diagnosing and optimizing app performance across four critical views.
The Performance view is dedicated to detecting UI jank and pinpointing rendering problems. It offers a Flutter frames chart visualizing UI and raster thread activity, a frame analysis tab for selecting any janky frame and seeing what caused the delay, a timeline trace viewer tracking widget builds, layouts, and paints to spot bottlenecks, and jank and shader compilation detection flagging frames exceeding 16ms or showing first-use shader compilation warnings.
The CPU Profiler records and visualizes execution on the UI thread, helping identify heavy synchronous tasks like big JSON parsing, sorting, or chart calculations that hog the main thread, and spotting microtasks and isolate method calls in a flame chart so you can refactor or offload them with compute() or Isolate.run().
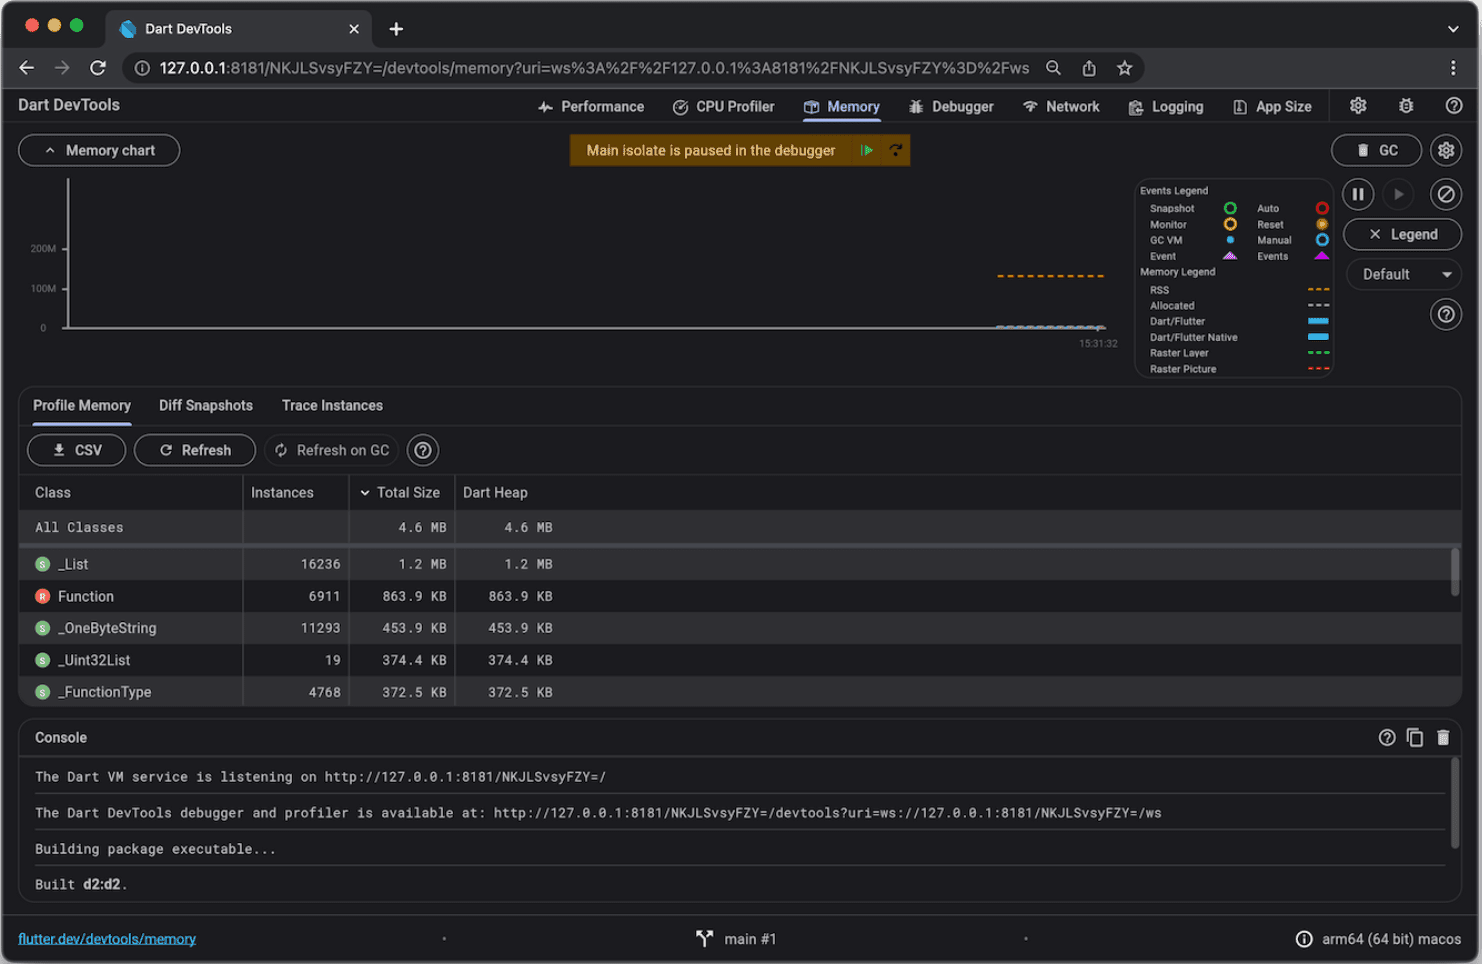
The Memory Profiler monitors live memory usage, allocation, and retention over time, detecting memory spikes from large image loading or unnecessarily retained scroll list items, revealing leaking controllers (AnimationController, ScrollController) that weren't disposed, and tracking "memory drift" where gradual increases point to disposal or listener issues.
The Network Profiler gives insight into API behavior and data flow, monitoring each request in real time to catch duplicated calls from multiple ViewModels or widgets firing the same API, analyzing slow responses and large payloads, and validating connectivity logic and caching strategies for offline-first use cases.
Essential third-party packages
| Package | Purpose |
|---|---|
| logger | Color-coded, filterable logs with levels (INFO, WARNING, ERROR) |
| alice | In-app HTTP inspector showing headers and responses |
| firebase_crashlytics | Production error monitoring for real devices |
| State management tools | Log events and state transitions |
| PrettyDioLogger | Enhanced dio console formatting |
Debugging common problem areas
For UI, the Widget Inspector's Repaint Rainbow highlights unnecessary repaints, and rebuild counters find excessive rebuilds. Fixes: use const constructors, RepaintBoundary, and ValueListenableBuilder.
For logic, common issues are multiple listeners, missing dispose(), and race conditions. Rule: dispose every ScrollController, AnimationController, StreamSubscription, and TextEditingController.
For deep links and navigation, common issues include AASA/CloudFront header mismatches, TeamID mismatches, double slashes, and wrong routing.
Build failures and release mode debugging
Build failures on iOS usually trace to provisioning profiles, bundle IDs, entitlements, or Podfile conflicts. On Android, it's Gradle mismatches, Dex errors, R8, multidex, or manifest merges. Use flutter build ios --verbose and flutter build apk --stacktrace for detailed logs.
For release mode debugging: test on mid-range devices, use profile mode for animations, monitor via Crashlytics or Sentry, and remember that release does not behave the same as debug.
Performance best practices
Use CachedNetworkImage for user uploads, offload heavy work with compute() or Isolate.run(), prefer ListView.builder over massive lists, pre-cache critical images, use const constructors to reduce rebuilds, dispose all controllers properly, and cache aggressively.
Systematic debugging workflow
Reproduce, creating reliable trigger steps. Profile, using the DevTools timeline, CPU, and memory tools. Inspect, using the Widget Inspector for rebuilds. Analyze, reviewing logs and breadcrumbs. Debug network, profiling API calls. Validate, testing in release mode. Monitor, watching for regressions.
Hoomanely context: why this matters to us
At Hoomanely, trust is everything. A janky UI or random crash undermines that trust directly. Each release focuses on making the experience faster, smoother, and more stable, from catching micro-jank to catching memory leaks early.
Key takeaways
Use DevTools routinely, not reactively. Augment with Sentry, logger, and Alice. Profile before optimizing. Dispose all controllers. Isolate heavy work off the UI thread. Cache aggressively. Always test in release mode. And make debugging continuous, not crisis-driven.