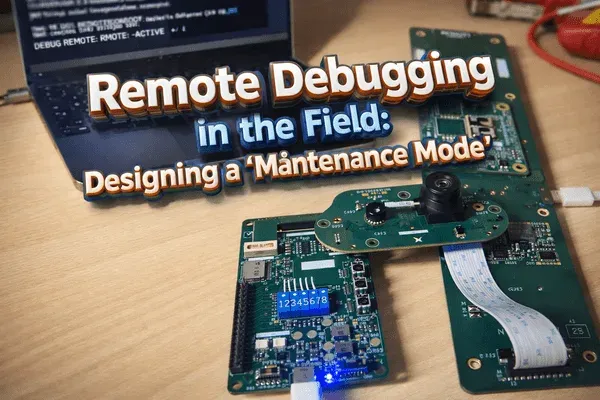
Remote Debugging in the Field: Designing a "Maintenance Mode"
Modern embedded systems face a real challenge: how do you diagnose and fix issues when hardware is deployed in the field, potentially thousands of miles away? Traditional debugging methods require physical access, which means costly technician visits and extended downtime. Remote debugging infrastructure changes that equation.
At Hoomanely, we've built a "maintenance mode" system that leverages UART and CAN communication protocols for comprehensive remote diagnostics, meaningfully cutting the number of on-site technician visits needed while giving us instant access to internal diagnostic logs across our distributed pet monitoring network.
The problem: field diagnostics at scale
Embedded systems deployed in real-world environments face debugging challenges that don't show up in lab settings. Traditional approaches fall short against intermittent issues that only occur under specific environmental conditions, network connectivity problems that block standard remote access, hardware-specific failures needing low-level diagnostic access, and time-sensitive operations where extended downtime isn't acceptable.
Our pet monitoring systems run continuously in homes across multiple regions, making physical access both expensive and slow. Each system runs multiple microcontrollers handling image processing, thermal analysis, and ML inference pipelines in real time.
Architecture overview: multi-protocol debugging
Our maintenance mode operates across a dual-communication architecture that keeps diagnostic access available even when primary networks fail.
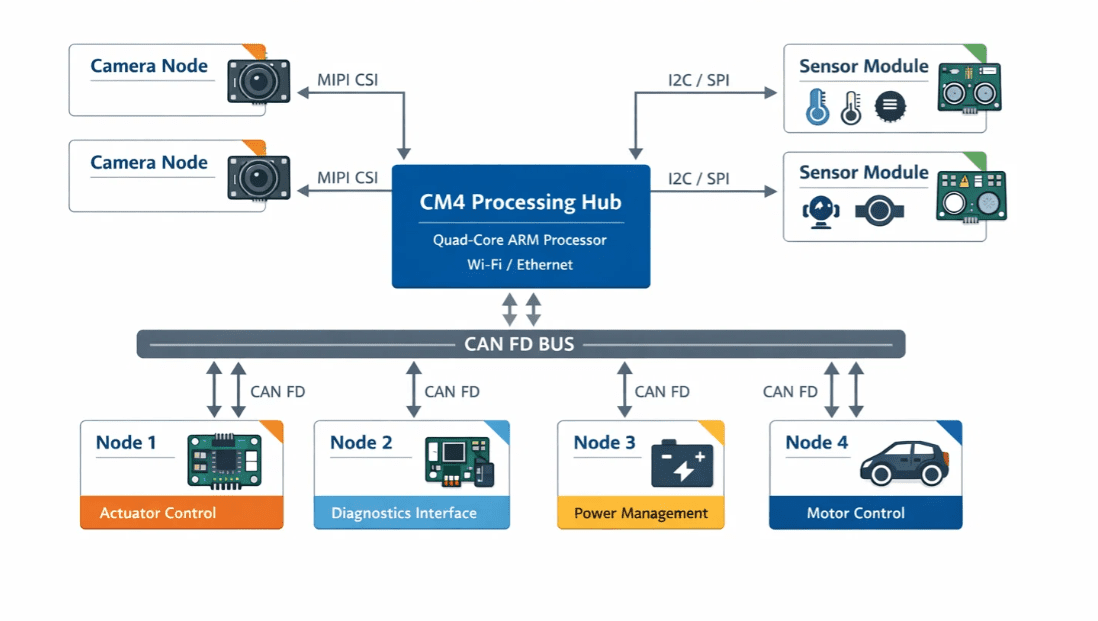
The primary stack centers on a high-performance CAN FD network connecting a Linux-based processing hub running diagnostic orchestration, embedded camera nodes handling capture and preprocessing, specialized sensor modules managing thermal and proximity sensing, and a communication bridge for CAN protocol translation to external access.
The UART diagnostic interface serves as the primary maintenance entry point, providing persistent logging channels that operate independently of system state, low-level hardware access for register dumps and memory inspection, failsafe communication that works even during system crashes, and a standardized diagnostic protocol across hardware variants.
The CAN-based diagnostic protocol
Our CAN FD implementation uses a custom VBUS protocol built for high-throughput diagnostic data exchange, supporting multiple message types for different debugging scenarios:
// VBUS message types for diagnostic operations
typedef enum {
    VBUS_MSG_DIAGNOSTIC_REQUEST = 0x100,
    VBUS_MSG_LOG_STREAM = 0x101,
    VBUS_MSG_MEMORY_DUMP = 0x102,
    VBUS_MSG_REGISTER_ACCESS = 0x103,
    VBUS_MSG_SYSTEM_STATUS = 0x104
} vbus_diagnostic_msg_type_t;
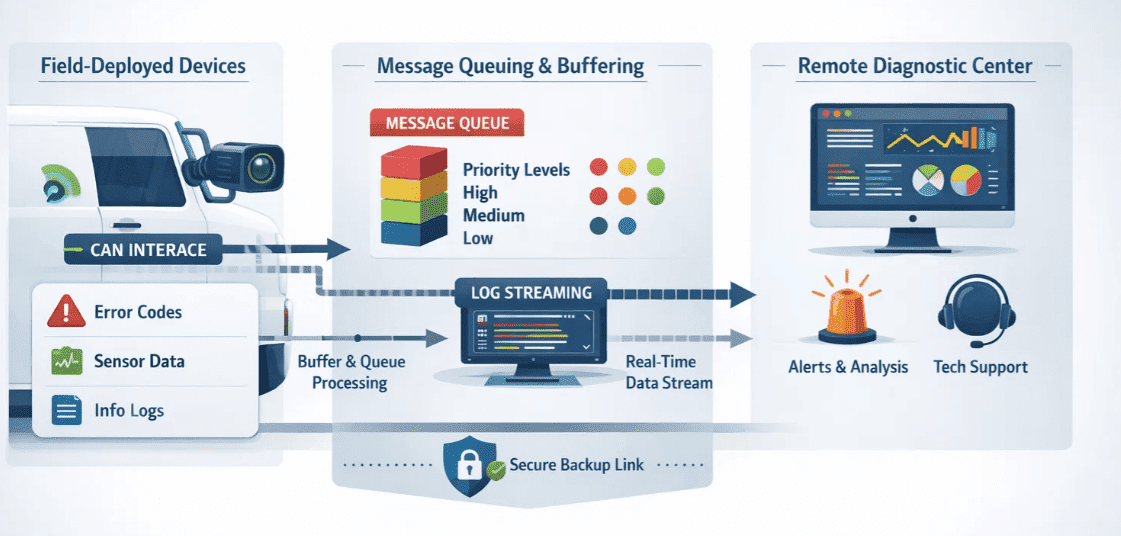
A priority hierarchy makes sure critical diagnostic messages get immediate attention. High-priority diagnostic requests bypass normal message queuing, so real-time system inspection is possible even under heavy operational load.
One of our key innovations is a 500,000-frame circular buffer with intelligent flow control, letting us continuously capture diagnostic data without impacting real-time operations. A dual-threaded architecture separates message reception from processing, automatic flow control prevents buffer overflow during diagnostic bursts, batch processing optimizes throughput while keeping latency low, and memory-mapped storage enables fast access to historical diagnostic data.
UART logger: failsafe diagnostic access
The UART logger is a completely independent diagnostic channel that operates regardless of system state, invaluable when debugging critical failures or communication breakdowns. It supports configurable logging levels:
// Configurable logging levels for different diagnostic scenarios
#define LOG_LEVEL_ERROR  1  // Critical failures only
#define LOG_LEVEL_WARN   2  // Warning conditions
#define LOG_LEVEL_INFO   3  // General system information
#define LOG_LEVEL_DEBUG  4  // Detailed debugging output
The logger automatically adjusts verbosity based on system load, keeping diagnostic information available without overwhelming the channel.
Advanced diagnostic capabilities
Maintenance mode gives us comprehensive low-level system access, including memory dump operations, register access for hardware-specific debugging, stack trace generation for crash analysis, and performance counter monitoring. Beyond debugging, it also enables remote configuration management, parameter adjustment without firmware updates, calibration data updates for sensor optimization, and diagnostic threshold tuning based on field conditions.
Performance impact and optimization
Comprehensive diagnostics require careful attention to overhead. We use conditional compilation so debug builds include full diagnostic capabilities while production builds can selectively disable features:
#ifdef MAINTENANCE_MODE_ENABLED
    LOG_DEBUG_TAG(tag, "Detailed diagnostic information");
#else
    // No-op in production builds
#endif
All diagnostic operations use non-blocking architectures that don't interfere with real-time operations. Background threads handle log processing and transmission while priority systems keep critical operations on their timing requirements.
Field results
Since deploying this infrastructure, we've measured meaningful operational improvements: fewer on-site visits for diagnostic and troubleshooting, average resolution time dropping from 2 to 3 days down to 2 to 4 hours, and a higher first-call resolution rate. We've also seen enhanced reliability through predictive maintenance based on diagnostic trend analysis, proactive issue detection before user-visible failures, and faster root cause analysis through comprehensive logging.
What's next: ML-powered diagnostics
Our next-generation diagnostic system is incorporating machine learning to analyze diagnostic patterns and predict failures before they occur, anomaly detection for unusual system behavior, predictive maintenance scheduling based on component wear patterns, automated root cause analysis using diagnostic data correlation, and intelligent alert prioritization to reduce false positives.
Why it matters at Hoomanely
This remote debugging infrastructure directly strengthens our ability to maintain and optimize a distributed sensor network with far less operational friction. Performing real-time diagnostics across thousands of deployed units lets us continuously improve algorithms and hardware performance based on real-world usage patterns, while ensuring pet families can rely on continuous, high-quality monitoring without service interruptions.
Key takeaways
Multi-protocol redundancy ensures diagnostic access even during system failures. Intelligent buffering enables high-throughput data capture without hurting performance. Layered diagnostic access provides the right tools for different failure scenarios. And security-first design protects systems while still enabling comprehensive remote access. For embedded systems operating at scale, remote debugging isn't just a convenience, it's an operational necessity.