The Debug Window: Why UART is a First-Class Feature in Every vBus Module
At Hoomanely, we design systems that work, but we also design systems that can be understood when they're working, diagnosed when behavior seems unexpected, and brought up efficiently during development. This philosophy led us to establish a fundamental design principle: every vBus module includes a dedicated debug UART as a mandatory, first-class feature.
Universal accessibility: the tools are everywhere
Unlike specialized debug interfaces requiring proprietary tools or expensive debuggers, UART works with equipment every engineer already has. USB-to-serial adapters cost $5-20 and plug into any computer with no drivers, licenses, or specialized software. Many development boards include built-in hardware UART ports. Terminal software like PuTTY, minicom, screen, or CoolTerm is cross-platform, free, and works identically regardless of operating system. A firmware engineer can test code changes, a hardware engineer can verify power sequencing, a manufacturing technician can run diagnostics, and a field service technician can collect logs, all using the same simple interface.
UART also operates at the lowest level of the system stack, requiring no OS initialization, USB enumeration, network configuration, display drivers, or filesystem mounting. This makes it the first interface available during system boot and the last interface functioning during system failures. When USB won't enumerate, when network stacks hang, when displays show nothing, UART still works.
Boot visibility: understanding system initialization
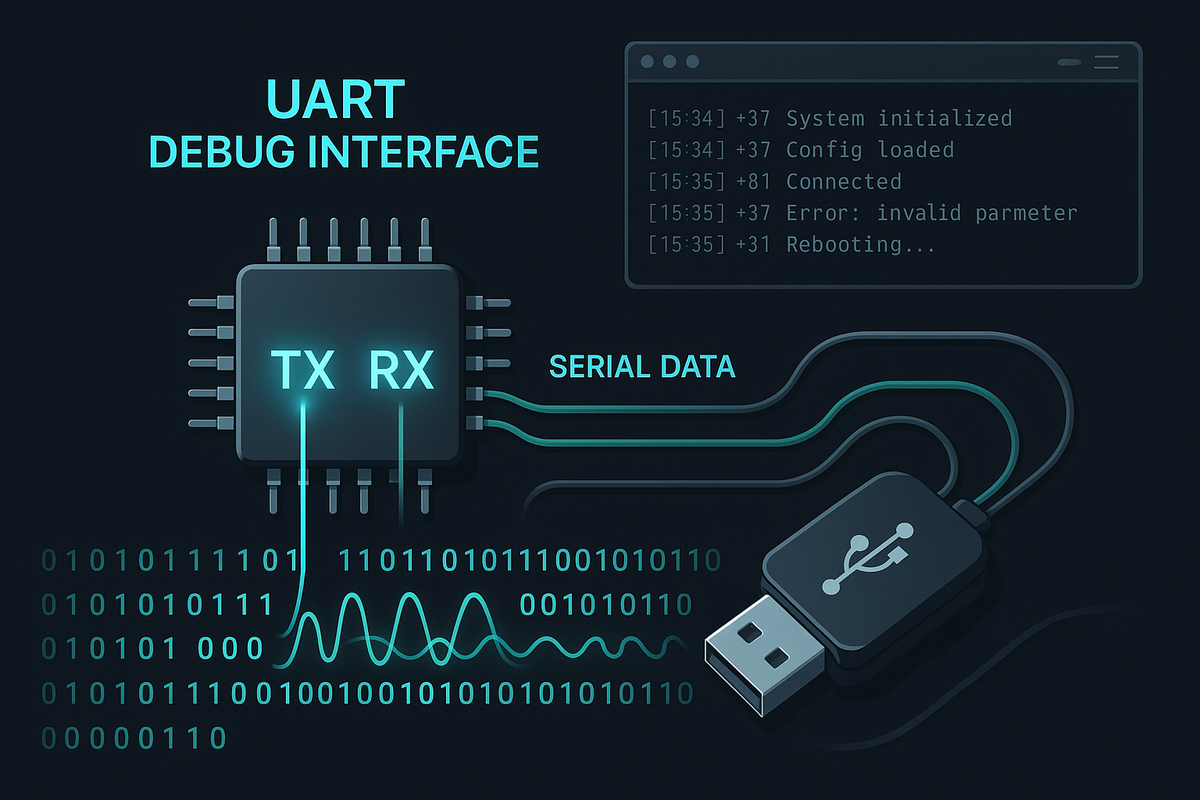
The moment power hits a vBus module, the debug UART becomes active, providing bootloader messages confirming version, CPU frequency, flash and RAM size, and firmware integrity checks, followed by kernel or RTOS initialization messages, then application startup messages showing module discovery over vBus. This visibility is invaluable during development, when a board doesn't boot, the UART output tells you exactly how far initialization proceeded before failure occurred.
During hardware bring-up, UART provides immediate feedback on fundamental hardware health. Clock configuration issues show up as garbled characters or no output. Boot code memory tests confirm RAM is functional. Monitoring code reports voltage levels on critical rails. Peripheral detection logs confirm I2C sensors, SPI flash, and other components are responding correctly. This accelerates hardware debug dramatically, instead of spending hours probing signals with oscilloscopes before knowing if anything works, UART gives immediate system-level status.
Runtime diagnostics: understanding system behavior
Once running, debug UART continues providing insight through task activity logging (sensor readings, WiFi status, data logging progress), performance metrics (CPU utilization, free heap, task execution times), and communication status (vBus traffic, CAN bus message rates, I2C transaction completion). This helps developers understand whether the CPU is overloaded, whether tasks are executing at expected rates, and whether communication is functioning properly.
Debug UART also excels at reporting unexpected events, protocol errors like I2C timeouts or CAN bus errors, resource issues like heap fragmentation or high stack usage, and peripheral problems like unresponsive sensors or slow flash writes. These messages provide interpreted context that raw logic analyzer data can't, telling you "sensor at 0x1E isn't responding" rather than just showing transaction timing.
Debug UART can be bidirectional too, many of our modules implement simple command-line interfaces for system control (status queries, module reset), configuration (setting WiFi credentials, saving to flash), and calibration (interactive sensor calibration routines). This transforms UART from a passive logging interface into an active development and testing tool.
Manufacturing test integration
In manufacturing, debug UART enables automated testing through scripted interactions, opening the serial port, sending test commands, and parsing responses for pass or fail determination. Manufacturing stations use UART to verify bootloader programming, check firmware version, write unique serial numbers, validate vBus enumeration, and confirm sensor calibration. The simplicity of UART makes test fixture development straightforward, no complex USB drivers, no network stack dependencies, just open the serial port, send commands, parse responses.
Manufacturing logs collected via UART feed into yield analysis systems, revealing which tests fail most frequently, whether failures correlate with specific component lots, whether certain power supply voltages show marginal behavior, and whether timing-sensitive operations show variation. This data-driven approach to manufacturing quality relies on comprehensive logging, and UART provides that infrastructure with zero complexity.
Field diagnostics: supporting deployed systems
When products are deployed at customer sites, debug UART enables remote diagnostics. A customer reports unexpected behavior, a support engineer requests they connect a USB-to-serial adapter, capture terminal output, and send the log. The log reveals the actual issue, like corrupted sensor calibration data falling back to factory defaults, transforming support from trial-and-error guesswork into data-driven diagnosis.
UART also provides real-time feedback during field firmware updates, showing download progress, checksum verification, installation status, and confirming successful reboot into the new version. This visibility reassures users during updates and helps diagnose failures if updates don't complete successfully.
vBus architecture integration
Every vBus SoM includes its own debug UART. The CPU SoM serves as the primary system console where bootloader, kernel, and application all log. The Power SoM reports power rail voltages, current consumption, fault conditions, and thermal status. Peripheral SoMs log sensor readings, calibration status, and operational state, helping isolate issues to specific modules. Communication SoMs report wireless connection status, network traffic, and protocol errors.
During development, we often monitor multiple UART ports simultaneously using USB-to-serial hub adapters, giving a multi-window view of comprehensive system visibility, how modules interact, timing relationships, and which module is the source of an issue. Across all vBus modules, we maintain consistent log formatting, timestamp, module, level, and message, enabling automated log parsing, filtering, and analysis regardless of which module generated a given event.
Hardware design: making UART accessible
We design UART accessibility into every board through a dedicated 4-pin debug header positioned for easy access, without needing to disassemble the product. Clear silkscreen labeling removes ambiguity about which pin is which, and a standard pinout across all products means a universal cable works everywhere. ESD diodes on TX and RX pins protect against static discharge when connecting cables.
Consumer USB-to-serial adapters typically output 3.3V logic, so our designs accommodate this even when the processor runs at a different core voltage, through level translation or a dedicated 3.3V IO bank. A VCC pin on the debug header can also power an indicator LED on some adapters, confirming the connection is live.
Development workflow integration
Automated hardware-in-the-loop testing via UART, triggered on every commit, ensures firmware quality without manual testing. During firmware development, UART provides instant feedback, modify code, build, flash, immediately see results in the terminal, no need to attach debuggers or set breakpoints for basic validation.
Conclusion: simple, universal, indispensable
In an era of sophisticated debug tools, JTAG, SWD, USB, Ethernet-based debugging, the humble UART remains our most reliable, most accessible, most universally valuable debug interface. Its simplicity is its strength, no complex protocols, no driver dependencies, no infrastructure requirements, just two signal wires, ground, and a window into system operation.
At Hoomanely, elevating debug UART to first-class feature status reflects our commitment to debuggability and testability. Products designed for visibility are products designed for reliability. As our vBus ecosystem grows and modules become more sophisticated, debug UART remains the constant, the reliable foundation that lets us understand, validate, and support everything we build.