When Optimization Breaks: The Debug vs Release Performance Paradox
In embedded systems development, there's a particularly frustrating class of bugs that every developer runs into eventually: code that works perfectly in debug mode but mysteriously fails when compiled for release. At Hoomanely, where we develop precision pet health monitoring devices with clinical-grade accuracy, this phenomenon has taught us real lessons about optimization trade-offs.
The optimization divide
Our edge AI devices capture and process thousands of sensor readings per minute, transmitting vital health data to our cloud infrastructure. When developing these systems, we routinely run into the classic embedded challenge: debug builds (-O0) work flawlessly, but release builds (-Os) introduce subtle failures that can compromise data integrity.
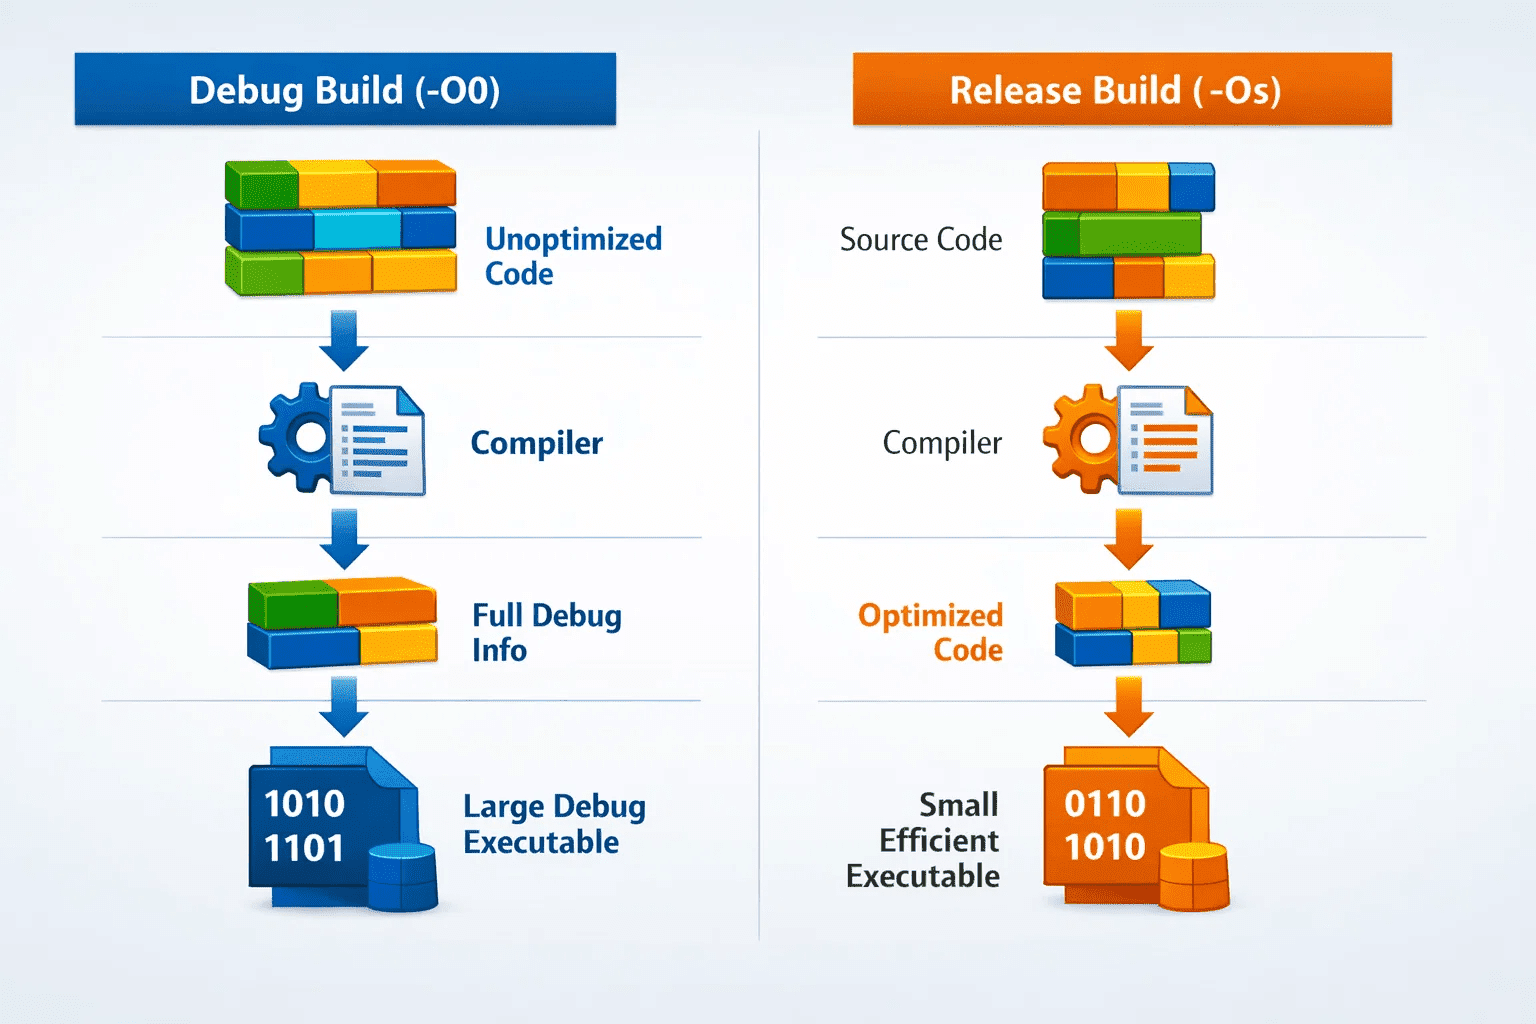
The distinction runs deeper than simple performance gains. Debug builds prioritize developer experience and debugging capability, while release builds focus on runtime efficiency and binary size. That philosophical divide creates genuinely different execution environments that can expose latent bugs.
Debug mode (-O0 -g3) has no optimization transformations, full debugging symbols, predictable execution order, stack frame preservation, and variable lifetime guarantees. Release mode (-Os -g0) applies aggressive size optimization, function inlining and loop unrolling, dead code elimination, register allocation optimization, and stack optimization and reordering.
A real case: memory management in pet monitoring devices
Our systems process multiple data streams simultaneously, thermal imaging, accelerometry, environmental sensors. During development we hit an optimization bug that illustrates this well.
In debug mode, our external PSRAM operations executed flawlessly with this pattern:
// PSRAM test pattern that worked in debug
uint8_t testPattern[4096];
uint8_t readBuffer[4096];

// Fill test pattern
for (uint32_t i = 0; i < sizeof(testPattern); i++) {
    testPattern[i] = (uint8_t)(i & 0xFF);
}

// Direct PSRAM write
for (uint32_t i = 0; i < sizeof(testPattern); i++) {
    *((__IO uint8_t *)(PSRAM_BASE_ADDRESS + i)) = testPattern[i];
}
When compiled with -Os, data corruption occurred sporadically, manifesting as incorrect sensor readings that could affect health monitoring accuracy.
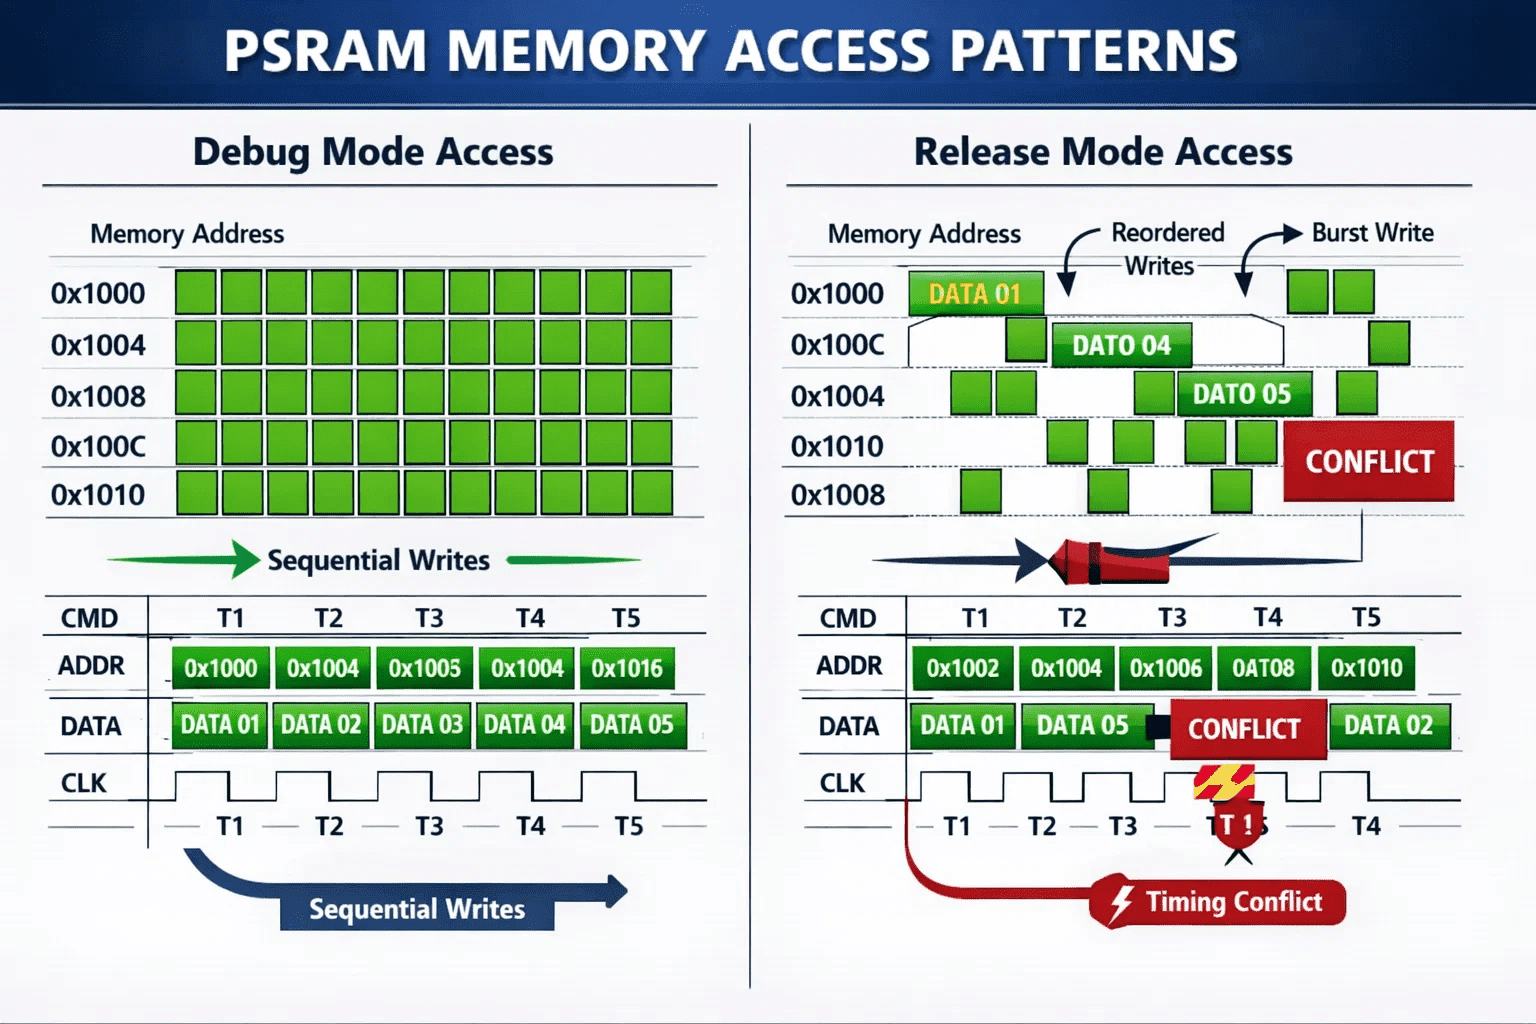
The root cause had three contributing factors. Memory access timing: release optimization reordered memory operations, causing write transactions to happen faster than the PSRAM interface could reliably handle. Debug mode's unoptimized execution had provided natural timing delays that were masking this hardware constraint. Volatile qualifier omission: the compiler optimized away redundant memory reads, assuming memory content stayed static, but our memory-mapped PSRAM interface needed volatile semantics to guarantee actual hardware access. Stack layout changes: optimization altered local variable placement, changing cache behavior and memory alignment, which affected DMA transfer reliability.
The fix
We implemented a multi-layered approach. Memory barriers for hardware synchronization:
// Added memory barriers for hardware synchronization
__DSB();  // Data Synchronization Barrier
__ISB();  // Instruction Synchronization Barrier
Proper volatile usage:
// Corrected memory-mapped access
volatile uint8_t* psram_ptr = (volatile uint8_t*)PSRAM_BASE_ADDRESS;
*psram_ptr = test_value;
And optimization-aware design: hardware abstraction layers that behave consistently across optimization levels, explicit timing controls independent of compiler optimization, and function attributes to control optimization on critical code sections.
The performance vs reliability balance
Our optimization work showed that aggressive size optimization (-Os) delivers real benefits for resource-constrained devices: a meaningfully smaller code footprint, which leaves more room for sensor data buffering, reduced flash wear through smaller program images, and lower memory requirements that enable more sophisticated AI algorithms. Link-time optimization added cross-module optimization that eliminated redundant function calls, improved inlining decisions across compilation units, and better constant propagation through the whole program. These gains came with debugging complexity and stability risks that needed careful mitigation.

Best practices for optimization-resilient code
Hardware interface discipline: always use volatile qualifiers for memory-mapped registers, and ensure proper memory barriers around hardware operations. Timing-independent logic: avoid relying on execution timing for correctness, use explicit synchronization instead of depending on debug mode's slower execution. Optimization testing strategy: test critical paths with maximum optimization enabled early in development, use static analysis to catch optimization-sensitive code, and build comprehensive automated testing across all optimization levels. Progressive optimization: start with -O1 to catch basic issues, graduate to -Os only after thorough validation, and use function-level optimization attributes to fine-tune critical sections.
Why it matters at Hoomanely
Our proactive approach to optimization challenges strengthens our precision healthcare technology. Solving these engineering problems builds a more robust foundation for our pet health ecosystem, so every sensor reading, every thermal image, and every behavioral pattern contributes reliably to longer, healthier lives for pets.
Key takeaways
The debug vs release performance paradox teaches us that optimization isn't merely about speed, it's about understanding the assumptions our code makes about its execution environment. Success requires disciplined hardware interface design that stays consistent across optimization levels, comprehensive testing that validates behavior under all compilation modes, and proactive optimization planning rather than reactive debugging. For embedded systems working on precision applications, the cost of optimization-induced bugs extends beyond development time, it directly touches the reliability of life-critical functionality.