Why Pet Data Needs a Knowledge Graph
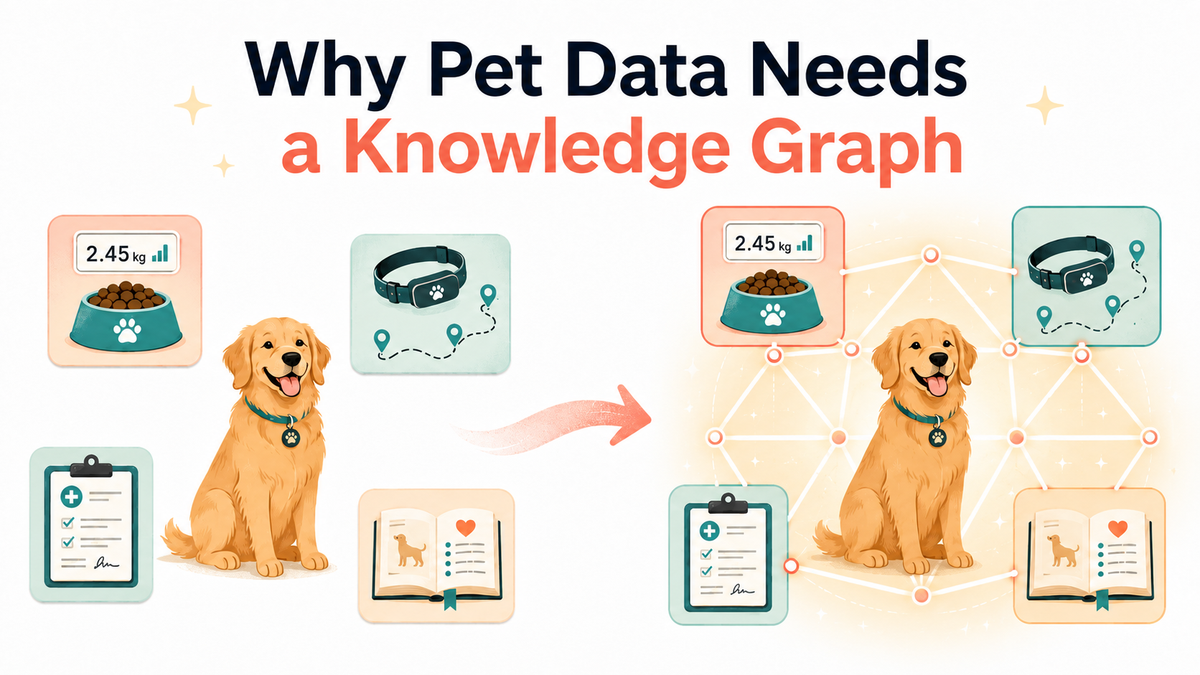
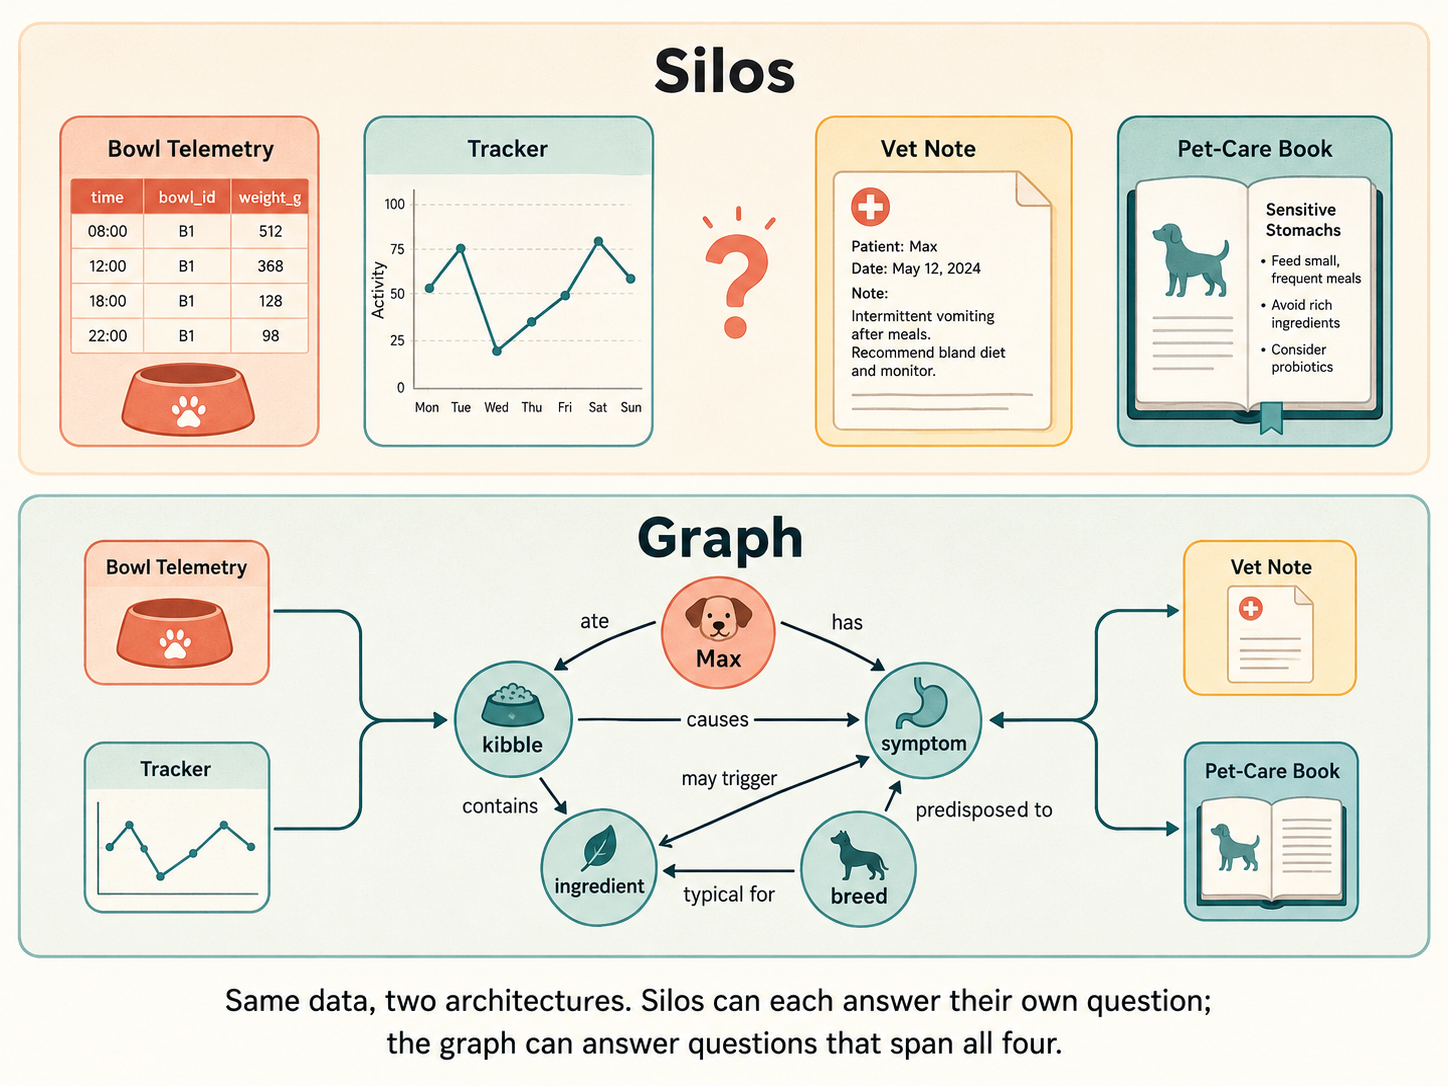
At 7:14 this morning, a smart feeding bowl logged something small: Max, a six-year-old golden retriever, left a third of his breakfast. His collar tracker says yesterday's walk was completely normal. A vet note from two weeks ago mentions mild tartar buildup. And a dog-nutrition book on our shelf points out that goldens often eat less during a heat wave.
Any one of those facts is unremarkable. Together, they might be a story — about the weather, about teeth, or about nothing at all.
The problem is that each fact lives in a system that has never heard of the others. This post — the first in a five-part series — explains why we built a knowledge graph to connect them, and why ordinary "search and summarize" AI wasn't enough for pet wellness.
One pet, four languages of data
A modern pet generates data in wildly different shapes. Our smart feeding bowl produces telemetry: grams served, grams eaten, meal duration, timestamps. The wearable tracker produces more of it: activity minutes, rest patterns, location trails. Vet records arrive as clinical prose. Pet-care literature is reference knowledge — thousands of pages about breeds, nutrition, and behavior that apply to every dog and no dog in particular.
A knowledge graph gives all of this one common shape: entities (Max, Brand X kibble, chicken meal, "scratching", the golden retriever breed) connected by typed relationships. A few real-shaped examples:
Max —[ate]→ Brand X kibble(this morning, 82 g of 120 g served)Brand X kibble —[contains]→ chicken mealGolden retriever —[predisposed to]→ heat sensitivity
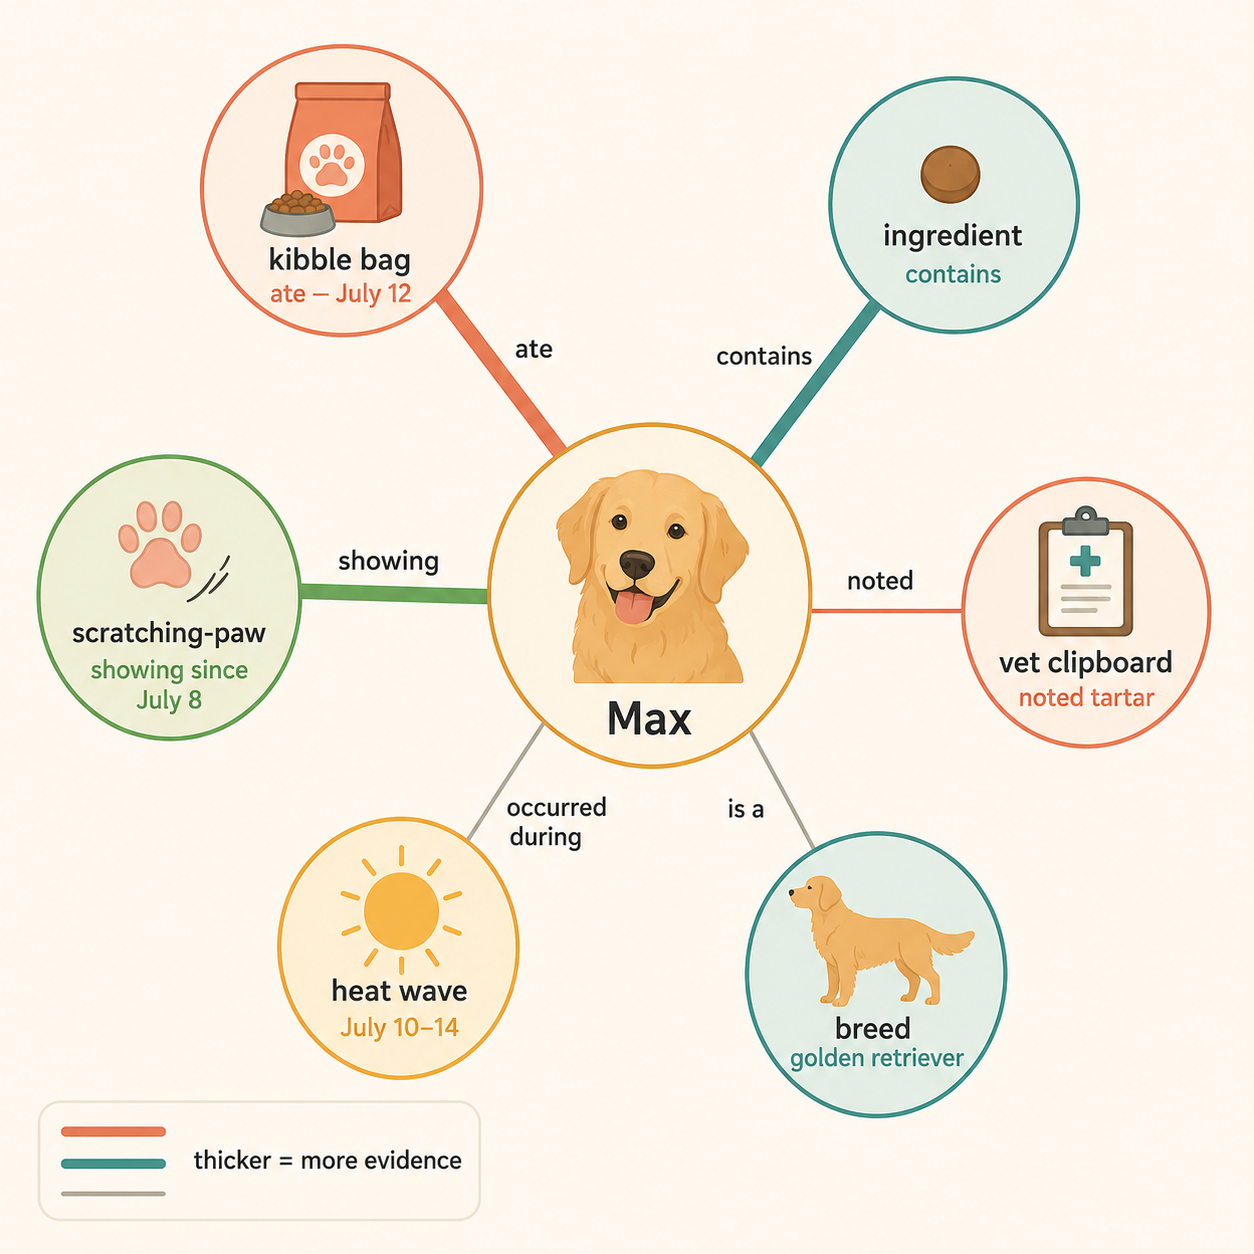
Every relationship carries three things beyond the fact itself: when it holds, where it came from (which bowl event, which vet note, which book page), and how much evidence has accumulated behind it. That last one matters more than anything, and Part 3 of this series is devoted to it.
When an AI assistant answers questions by traversing this graph — instead of just searching text — the approach is called GraphRAG (graph-based retrieval-augmented generation). That's what powers ours.
Why not just embeddings?
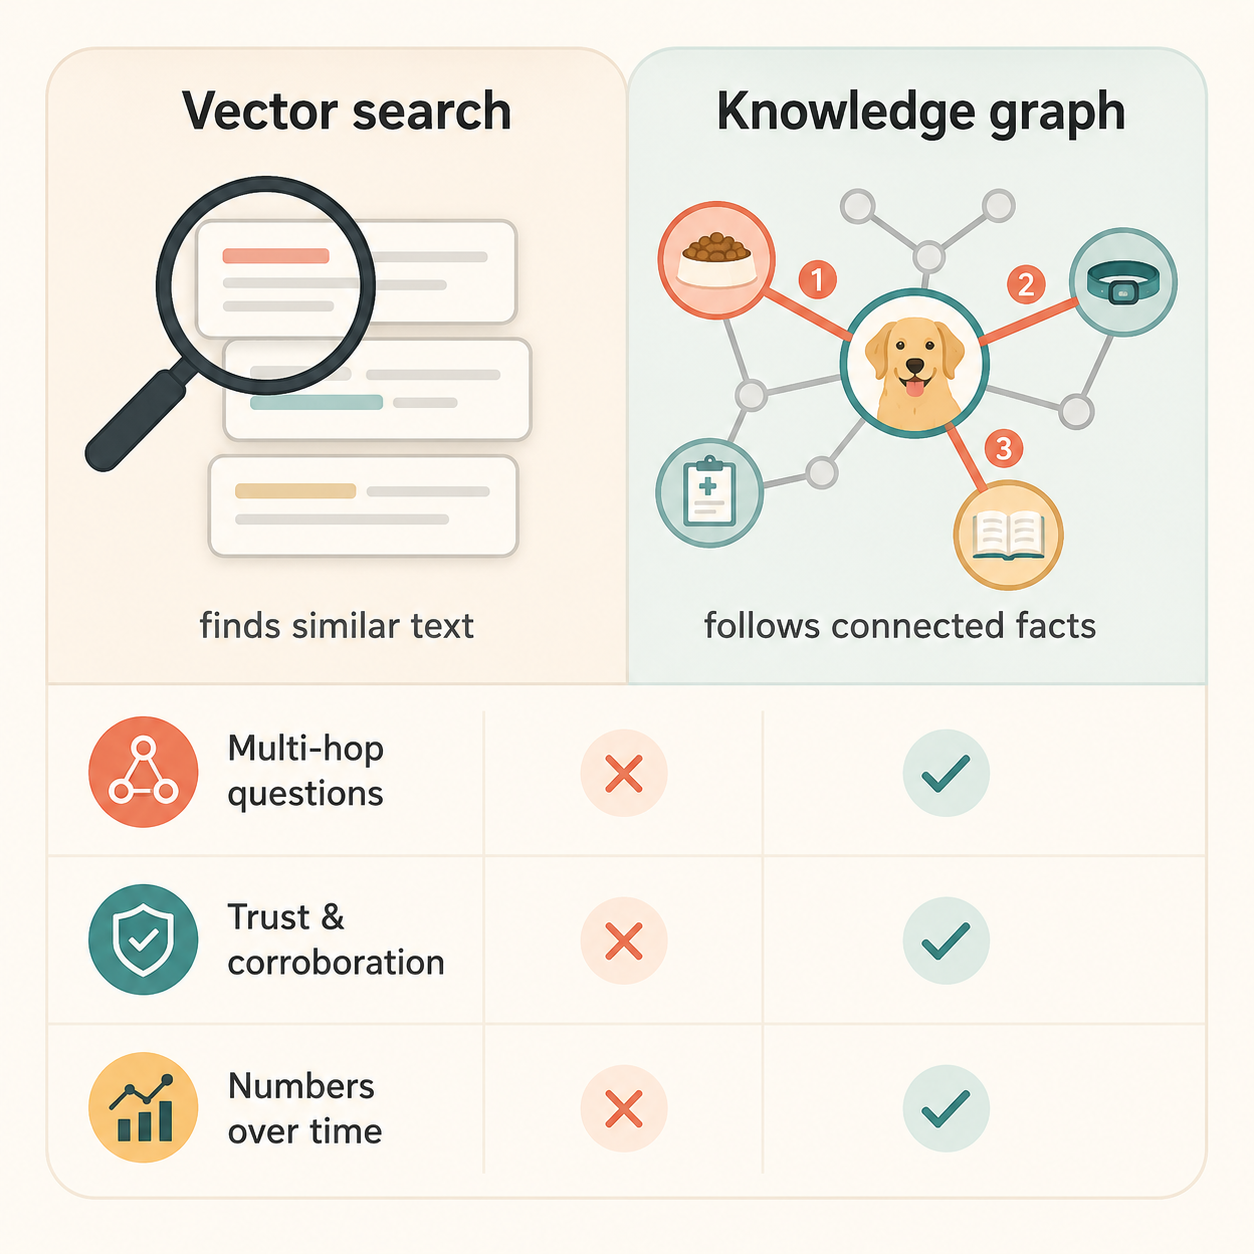
The standard recipe for "chat with your data" is vector search: split every document into chunks, embed each chunk as a vector, and when a question arrives, fetch the chunks whose vectors sit closest to the question's vector. It's a fine recipe for looking up passages. We use embeddings too — but never as the thing that decides what's relevant. Three failure modes forced that decision.
1. The answer is a path, not a paragraph. Take a question a pet parent actually asks: "Could Max's new food explain his scratching?" The answer requires joining three facts: Max switched foods on July 5 (bowl data), the new food contains chicken meal (product data), and chicken is a common allergen for retrievers (literature). No single chunk contains that chain — so no similarity search can retrieve it. Similarity finds text that looks like the question. It cannot follow a relationship it has never read in one place.
2. Similar isn't trustworthy. If one blog post claims grain-free diets fix everything and a veterinary handbook disagrees, a vector store hands you whichever chunk matches the query wording better. It has no concept of corroboration — that a fact confirmed independently by the bowl, the vet, and the literature deserves more weight than a fact asserted once, and that a contradicted fact should be demoted rather than tossed in a bag with everything else.
3. Pets are measured, not just described. "Is Bella eating less than usual?" is not a text question. It's a windowed aggregate over a time series — this week's intake versus her rolling baseline, ideally adjusted for what's normal in beagles. Embeddings don't do arithmetic. A pet-data platform has to treat numbers as numbers and connect them to meaning.
How the pet graph works — the 10,000-foot view
The rest of this series walks the pipeline end to end. Here's the shape of it.
Everything becomes evidence. Device telemetry lands as time-stamped numeric facts attached to graph entities, plus short event narratives ("Max's breakfast, July 12: 82 g of 120 g in six minutes"). Vet notes, articles, and book chapters are split into passages. Every fact in the graph stays traceable back to the exact passage or device event that produced it.
Machines extract, then verify. Zero-shot ML models pull out entities and relationships — no per-domain retraining needed, which is how the same engine handles kibble brands, symptoms, and breed traits. Before anything is written to the graph, a verification model checks that the source text actually entails the extracted fact. If the evidence doesn't support it, it doesn't go in. (Part 2.)
Facts accumulate belief. Every relationship carries a weight that grows as independent sources corroborate it, shrinks when sources contradict it, and honestly says "uncertain" when the evidence is thin. Re-reading the same source twice earns nothing. (Part 3.)
Questions walk the graph. Retrieval starts from the entities mentioned in your question, walks outward along evidence-weighted relationships, assembles the connected subgraph that best explains the answer, and cites its sources inline. (Part 4.)
What this unlocks
Once the graph exists, features stop being one-off integrations and start being queries.
- Answers with receipts. Ask why the assistant thinks Max's appetite dipped and it cites the bowl events, the vet note, and the page of the book it leaned on — every claim traceable to a source.
- Proactive wellness, not dashboards. Patterns that live across silos — appetite drift plus scratching plus a recent food change — become visible because they're literally connected.
- Vet-ready context. A visit summary can pull the last month of measured behavior with provenance, instead of a pet parent's best recollection.
- Breed-aware interpretation. Literature knowledge sits in the same graph as Max's telemetry, so "normal for a golden in July" is one hop away from his actual data.
Where this fits at Hoomanely
Hoomanely is building a connected wellness ecosystem for pets: smart devices like our feeding bowl and wearable tracker, and an AI companion that helps pet parents understand what their dog can't tell them. The knowledge graph is the layer that turns device signals into understanding — it's how a gram reading at 7:14 a.m. becomes part of an answer a pet parent can actually trust. Everything in this series exists to serve that mission: fewer surprises at the vet, earlier signals, and explanations instead of black-box guesses.
Key takeaways
- Pet data is fragmented by design — devices, vets, and literature speak different languages. The insight lives in the connections.
- Vector-similarity RAG retrieves look-alike text; it fails on multi-hop questions, corroboration, and numeric baselines — the three things pet wellness runs on.
- A knowledge graph stores entities, typed relationships, time, provenance, and evidence weight in one structure that both numbers and prose can join.
- GraphRAG means retrieval walks relationships instead of matching words — so answers come with reasoning paths and citations, not vibes.
Next in the series → Part 2: From Smart Bowl Signals to a Living Pet Graph — how raw telemetry and messy prose both become verified graph facts.