Debugging a Fleet You Can't Touch: Unified Logging
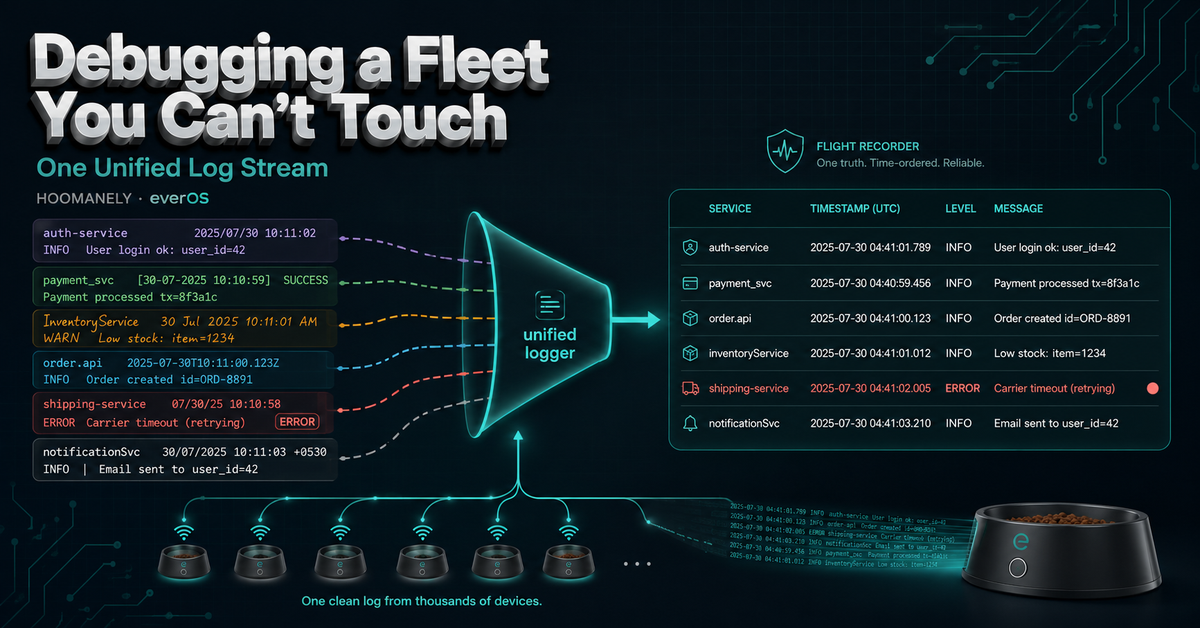
When a device misbehaves on your bench, you attach a debugger, tail a log, poke at it. When that same device is a smart pet bowl in a stranger's kitchen — one of thousands, behind a home router, with no screen and no one to read a terminal — none of that works. You get one shot: whatever the device wrote down about itself has to be enough to understand what went wrong, after the fact, from the cloud. The problem is that a bowl runs about a dozen independent services, each logging in its own style, to its own place, at its own idea of what counts as an error. Debugging that means correlating a dozen streams by hand. So we built a single service whose only job is to fold every one of those streams into one clean, uniform, grep-able log — the fleet's flight recorder.
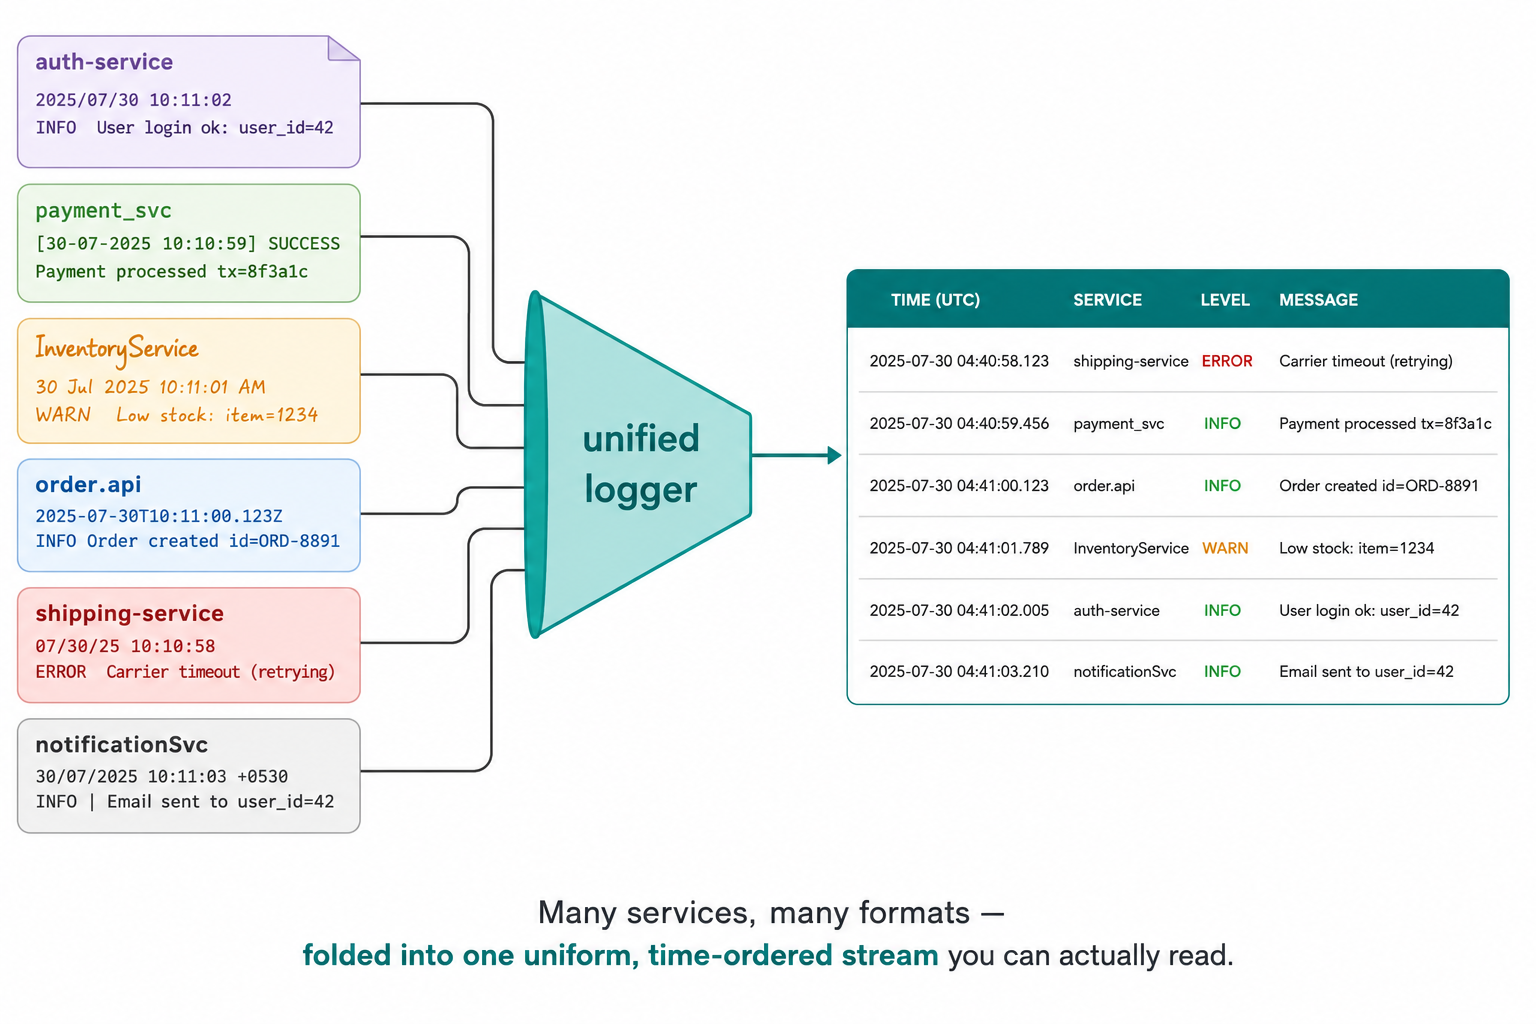
The Problem: A Dozen Voices, No Common Language
A modern edge device isn't one program; it's a small operating system of cooperating services — capture, upload, weight, onboarding, a watchdog, a heartbeat, and more. On our bowl there are roughly a dozen, each a separately supervised unit.
Each of those services logs however its author wrote it. Timestamps differ, severity conventions differ, and a firmware component's printf output looks nothing like a Python daemon's structured record. To reconstruct a single incident — "why did captures stop at 3 p.m.?" — you'd have to open a dozen logs and mentally interleave them by time.
That's tedious on one device and impossible across a fleet. If you can't read a device's history as one coherent timeline, you can't debug it remotely — and remote is the only way you'll ever touch it.
The Approach: Tap the Journal, Normalize Everything
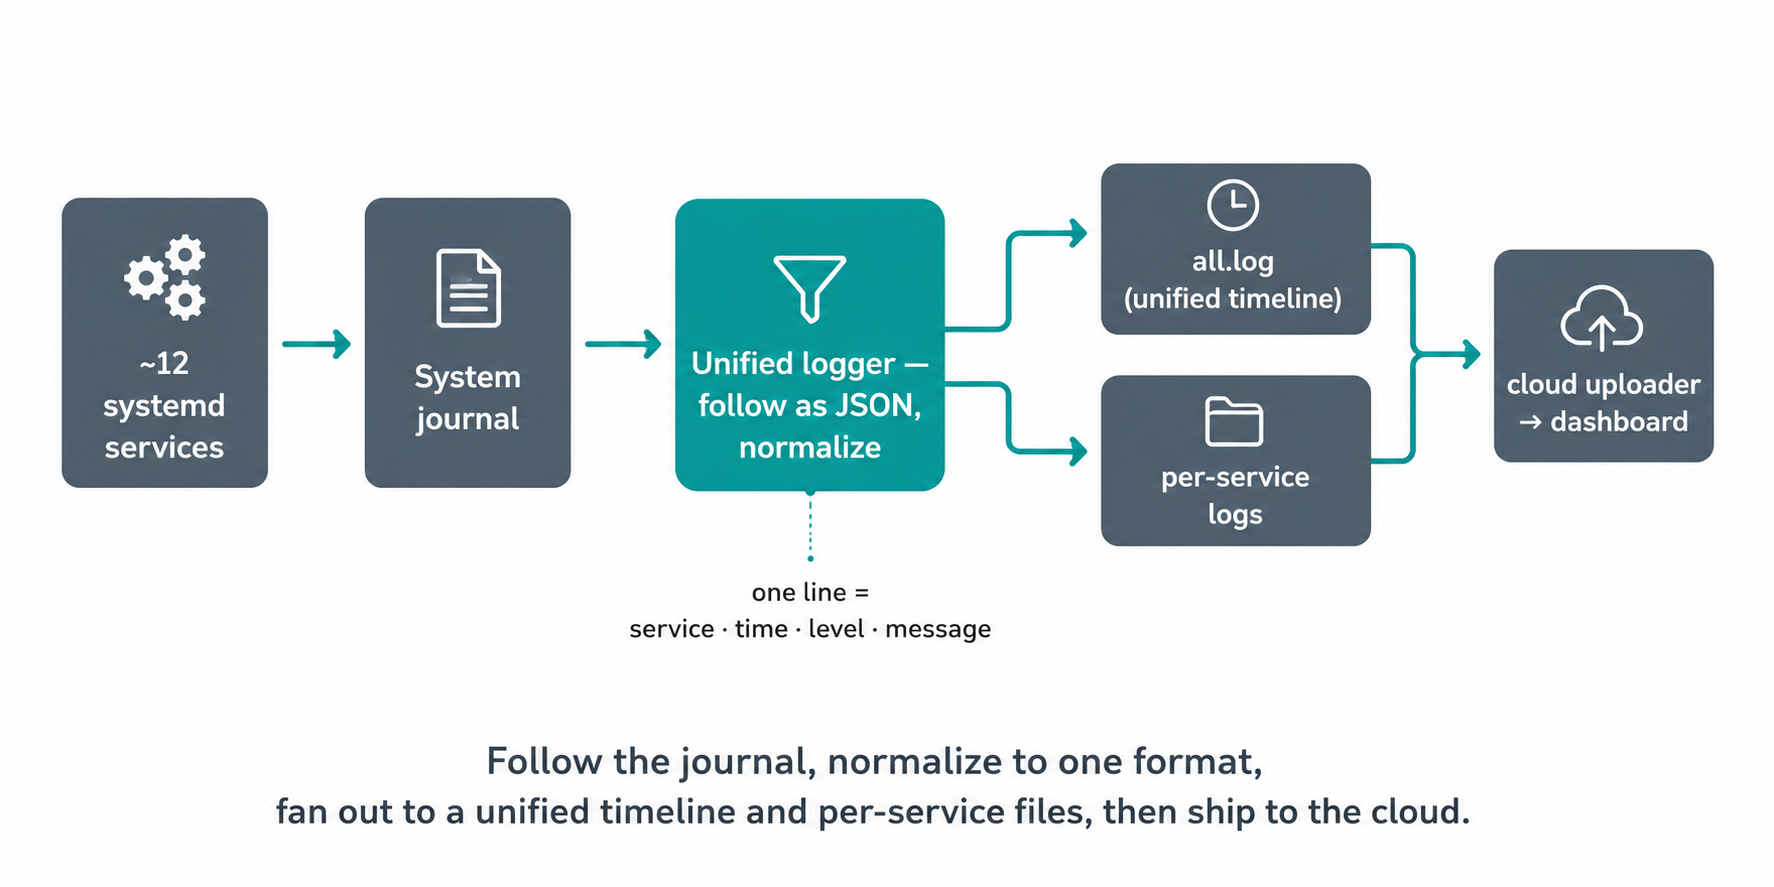
The Linux system journal already collects every service's output in one place — it just doesn't present it the way a debugger wants. So our logger follows the journal for exactly the units we care about, asks for the records as structured JSON, and re-emits each one in a single canonical line format.
Following the journal as JSON is a deliberate choice: it keeps each record's fields — which service, what priority, the precise timestamp — cleanly separated, so we never have to fragile-parse a pre-formatted string.
196	    cmd = ["journalctl", "-f", "--since=now", "-o", "json", "--no-pager"]
197	    for u in UNITS:
198	        cmd.extend(["-u", u])
199
200	    print(f"[cm4-unified-logger] starting: {' '.join(cmd)}", flush=True)
201
202	    proc = subprocess.Popen(
203	        cmd,
204	        stdout=subprocess.PIPE,
205	        stderr=subprocess.STDOUT,
206	        text=True,
207	        bufsize=1,  # line-buffered
208	    )
The -f follows forever; --since=now avoids dumping the whole backlog on startup. Every service we care about is listed explicitly, so the stream is scoped to the product's own units and nothing else.
Each record is then normalized to one line: service · ISO-8601 UTC timestamp · level · message. That single format is the entire point — every line, from every service, reads the same way and sorts by time.
243	        out = f"{short} {ts} {level} {msg}"
244	        root.info(out)
245	        get_service_logger(short).info(out)
Notice the fan-out on the last two lines: the same normalized line goes into a unified all.log and a per-service file. You get one timeline for correlation, and a filtered view per subsystem when you already know where to look.
The Hard Part: Not Crying Wolf
Emitting a uniform line is easy. The genuinely tricky part is deciding each line's severity — because a wrong severity is worse than none. If harmless lines get flagged as errors, the dashboard fills with false alarms and real problems drown in noise.
The subtlety: many firmware components embed their own severity in the text of a message while inheriting a neutral priority from the journal. So the logger upgrades a line's level when the message clearly marks itself as an error — but only carefully. It trusts an explicit bracketed marker like [ERROR], and otherwise an uppercase keyword, unless the line matches a denylist of known-benign templates.
91	# Lines containing any of these substrings are NEVER upgraded above
92	# their journald priority. They were producing thousands of false-ERROR
93	# events/week because the legacy classifier substring-matched ERROR /
94	# FAILED / CRITICAL inside otherwise-healthy messages:
95	#   - "bowl_weight_critical"  is a firmware *version name*, not a problem.
96	#   - "error-active (normal)" is the CAN bus *healthy* state.
97	#   - "[QUEUE-METRICS] [periodic_summary] ... Failed: 0 ..." is a heartbeat.
Those comments are hard-won. A firmware version named "bowl_weight_critical" was being reported as a critical error; the sensor bus's perfectly healthy "error-active (normal)" state was tripping the word "error"; a heartbeat line proudly reporting "Failed: 0" was counted as a failure. Each was thousands of false errors a week until the denylist silenced them.
128	    level = PRIO_TO_LEVEL.get(prio, "INFO")
129	    if level in ("INFO", "NOTICE", "DEBUG"):
130	        # Skip upgrade entirely for known-benign templates.
131	        if any(d in message for d in _UPGRADE_DENYLIST):
132	            return level
133	        # Strong signal: explicit bracketed marker.
134	        if _BRACKET_ERROR_RE.search(message):
135	            return "ERROR"
The lesson baked into this function is that log classification is a product problem, not a regex problem — it only gets accurate by learning your own system's vocabulary and refusing to pattern-match against it blindly.
Small, Bounded, and Happy to Die
Two more design choices keep the logger safe to run forever on a storage-constrained device. First, every output file is size-capped and rotated — a couple of megabytes with a few generations — because a companion uploader ships the rotated files to the cloud every minute and deletes them, so local files only need to survive a brief outage, not archive history.
Second, the logger has no internal retry loop. If the underlying journal follower ever dies, the logger simply exits and lets the service supervisor restart it clean:
247	    # If we reach here journalctl exited — signal systemd to restart us.
248	    rc = proc.wait()
249	    print(f"[cm4-unified-logger] journalctl exited rc={rc}", flush=True)
250	    return 1 if rc != 0 else 0
This is the "let it crash" philosophy: rather than nurse a complex internal recovery path, keep the program simple and lean on the supervisor that's already watching it. Fewer states, fewer bugs, faster recovery.
The Results: One Grep Away From an Answer
The payoff is that any incident on any device becomes a single, time-ordered story. An engineer pulls one file and reads the whole device's behavior across every subsystem in sequence — no interleaving a dozen logs by hand, no per-service format quirks. Because the format is uniform, it's trivially filterable: one service, one severity, one time window, with ordinary text tools.
At fleet scale, that uniformity is what makes cloud-side debugging possible at all. The rotated logs flow to the backend continuously, so the team can inspect a device's recent history from a dashboard without ever logging in — and because the severity classification stopped crying wolf, the errors that show up are real ones worth chasing.
Why It Matters at Hoomanely
Hoomanely is reinventing healthcare for pets — replacing reactive, imprecise care with continuous, clinical-grade monitoring that catches problems early. Our devices form a Physical Intelligence ecosystem: sensors fused at the edge, feeding the Biosense AI Engine that turns raw signals into personalized, preventive insights.
A fleet of health devices in homes only stays trustworthy if we can see what each one is doing and fix issues before a pet parent ever notices. Unified logging is the observability layer that makes that possible: one honest, uniform record per device, shipped to where we can read it, with the noise filtered out so real signals stand up. It's the difference between guessing about a device in the field and knowing.
It also embodies a quiet principle we hold: the device should tell the truth about itself, clearly. Getting a dozen chattering subsystems to speak one calm, common language is unglamorous plumbing — and it's exactly what lets the rest of the system be reliable at the scale of thousands of homes.
Key Takeaways
- One format beats a dozen. Normalizing every service into a single
service · time · level · messageline turns an un-debuggable jumble into one readable timeline. - Tap structured data, don't parse strings. Following the system journal as JSON keeps fields clean and avoids fragile re-parsing of pre-formatted text.
- Severity is where the danger is. Blind substring matching on "error" manufactures thousands of false alarms; a denylist of your system's own benign vocabulary is what makes classification trustworthy.
- Bound your storage, ship, and delete. Size-capped rotation plus a cloud uploader keeps a constrained device's logs useful without ever filling the disk.
- Let it crash. No internal retry loop — exit on failure and let the supervisor restart you clean; fewer states means fewer bugs.
Author's Note
This unified logger runs on the compute module inside Hoomanely's Everbowl, quietly turning a dozen chattering services into one honest record we can read from anywhere. It's the least glamorous service on the device and one of the most useful — the flight recorder that makes a fleet in customers' homes debuggable without ever knocking on a door. When a pet's health data depends on a device staying healthy, being able to see that device clearly is not optional.