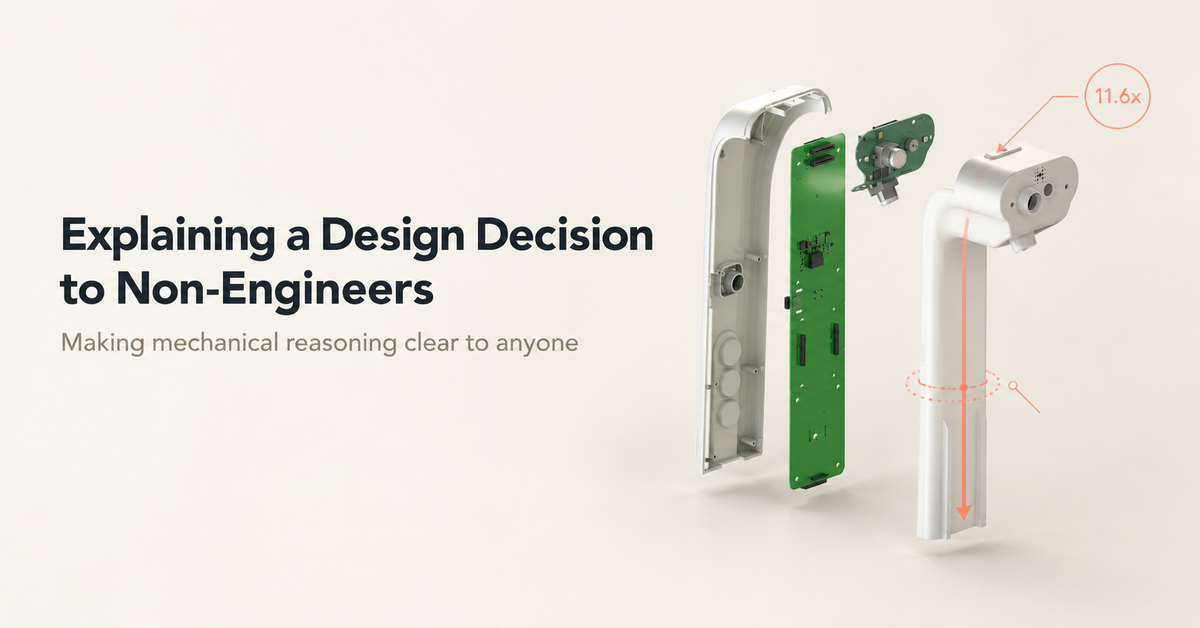
Explaining a Design Decision to Non-Engineers
Great design decisions travel faster when everyone can picture them. A fastener choice, a foam type or a surface finish is second nature to engineers, but to teammates in design, operations or marketing the same choice can sound like a list of specialist terms.
While taking EverBowl™ through late-stage engineering, we found that clarity sped up approvals more than extra data did. This post shares the method we use, with real decisions from our work.
Lead with the decision
We used to open with the method: “We ran a Roark’s formula check on the ring...” Teammates were polite, but the key point arrived too late to land.
Now we open with the answer and the ask. The decision is to use three M10 bolts on the load cell ring. The reason, in one line, is that they clamp harder and resist tilting better than six M4 bolts. The ask is approval by Friday so tooling can start. The analysis stays ready for anyone who wants to go deeper.
Tell the load path as a story
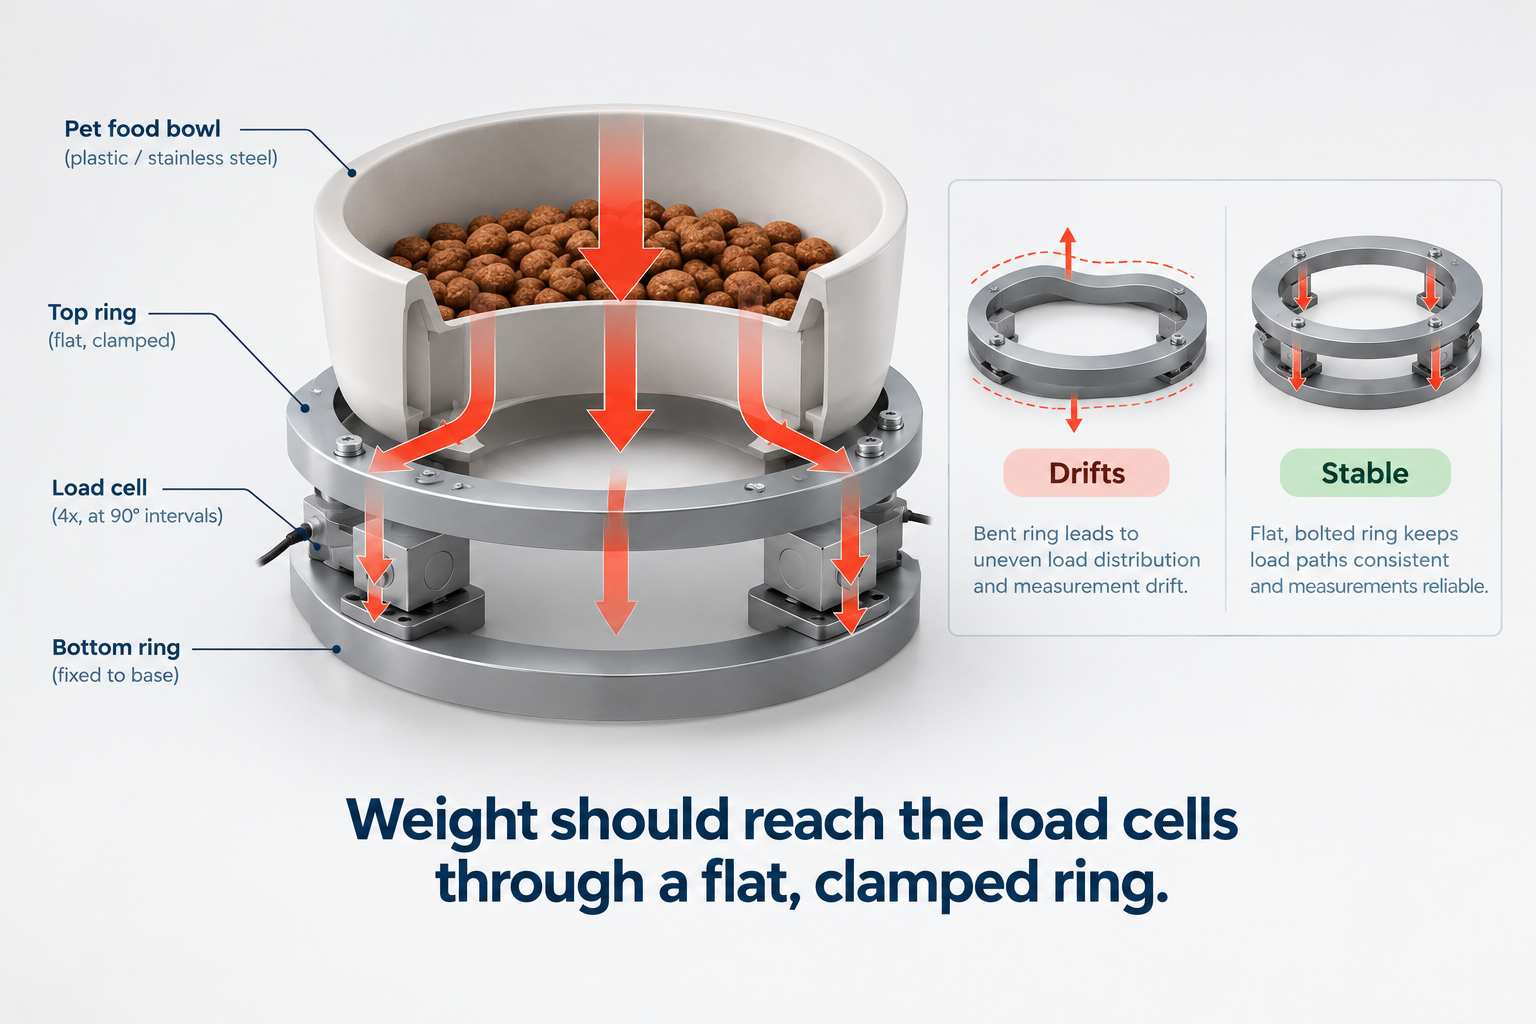
Explain what goes wrong first, then explain the fix. EverBowl weighs food and water with TAL220 load cells wired as a Wheatstone bridge, so the plain version of the ring problem is: “A bowl full of food presses down on four points. If the ring flexes, the reading drifts. Bigger bolts clamp the ring flat, so it can’t flex.”
The mechanism behind it is simple. A load cell measures tiny strain, and any extra bending in the ring adds strain that isn’t weight. The bridge can’t tell the difference.
An engineeringing fact
Stories convince people, and one fact makes them stick. Pick the fact that answers “why this and not the other,” and leave the rest as backup.
For the fasteners, that fact is stress area. A standard M10 bolt has a tensile stress area of about 58 mm², while an M4 has about 8.8 mm². Three M10 bolts give roughly 174 mm² of load-carrying area, and six M4 bolts give roughly 53 mm², which is about 3.3 times less.
Clamp force follows the same logic. For a tightened bolt, the relation is T = K × F × d, where T is tightening torque, F is clamp force, d is bolt diameter and K is a friction factor, typically around 0.2 for dry steel. For the same K and tightening fraction, a larger bolt gives far more clamp force.
Tilt resistance adds a second benefit. The moment a joint can resist is roughly clamp force times distance from the center, so fewer, stronger bolts on a well-chosen circle resist tilting better than many small ones.
Engineering Insight
Everything beyond the one deciding fact is backup, not the headline.
Single analogy
One familiar comparison beats a stack of them. Clamping force becomes a vise versus a pile of paper clips. Foam packaging becomes a seatbelt for the product. Surface finish becomes the difference between a sticky drawer and a smooth one.
Over-constraint becomes a four-legged table that wobbles on uneven floors, and that one explains our stabilizer design. A ring held in too many places fights itself, so we used vertical pin-in-bushing joints at 90 degree positions to locate the ring without forcing it. A three-legged stool never wobbles, and the same idea applies here. If an analogy needs its own explanation, swap it.
Compare options in one table
Side-by-side choices are easy to compare. Keep the columns to cost, effort and risk, which is what most teammates care about.
Our 25-unit prototype packaging decision looked like this:
| Option | Approx. cost for 25 units | Effort | Main risk |
|---|---|---|---|
| Vendor foam tooling | ₹80,000+ | Low for us | High cost for a small run |
| DIY PU pour with 3D-printed PETG molds | ₹3,500 to ₹6,500 | Medium | Needs a test round to tune |
We also compared EPS, PU and EPE foam. The backup was the Dow ETHAFOAM cushioning methodology, which sizes foam by product weight and contact area. We classified EverBowl and the Hub at a fragility of 60 to 85 g, which is the peak deceleration the product should see in a drop, and foam is then chosen so transmitted shock stays under that limit.
The recommendation, said out loud: “Go with the DIY pour. It saves more than ₹70,000, and we can move to vendor tooling if volume grows.”
Give one number people can feel
Raw engineering numbers need translating. Our load cell ring has a minimum factor of safety (FOS) of 11.6 at 3 kg, from Roark’s deflection and stress formulas. In plain words, the ring can carry roughly eleven times that load before it yields. The formula can stay in the appendix, and the takeaway is generous margin.
Here is a translation sheet we reuse:
| Engineering term | Plain words | Evidence to bring |
|---|---|---|
| Factor of safety 11.6 | About 11x margin | Roark’s calculation at 3 kg |
| Clamp force | How tightly parts are pressed | Stress area and torque relation |
| g-factor 60 to 85 g | How hard a knock it can take | Fragility class and cushion curve |
| IP65 / IP67 | Splash proof / survives submersion | Pre-compliance test plan |
| VDI / SPI spec | How the finish looks and feels | Sample plaque from the mold |
Name the risk and the fallback
Decisions feel safer when the downside is stated up front. Share one risk and one backup. For packaging, the risk is that the first foam pour may not fit the corners cleanly, and the fallback is to re-cut the mold, which costs a few days, not the whole budget.
IP ratings follow the same pattern. IP65 is the minimum for the bowl area and IP67 is needed for submersion. The lens seal and the microphone acoustic port are the highest-risk certification points, so we say that plainly and plan pre-compliance testing before the formal run. It keeps the discussion short, because the obvious “what if” is already answered.
Engineering Insight
A decision is easy to approve when the listener can repeat it in one sentence.
Habits we dropped
We stopped opening with method instead of the answer, and we stopped showing five options when two were realistic. We also dropped part names and standards from the first minute, and we no longer leave the downside for later. Long documents without a summary line on top went too, along with any number quoted without the load or condition it applies to.
How we measure it
We track two metrics per decision.
Approval Cycle Time (days)
Approval Cycle Time = Date approved - Date proposed
Clarification Question Rate
Clarification Question Rate = Follow-up questions ÷ Decisions presented
Illustrative numbers (hypothetical, not measured): before this method, a decision took about 5 days and drew about 6 follow-up questions. After, it took about 2 days and about 2 questions, which is 60% faster and 67% fewer questions. A falling question rate shows the explanation is landing, and a falling cycle time shows clarity turning into decisions.
Hoomanely Context
Hoomanely builds a three-product pet tech ecosystem: EverBowl, a pet wearable Tracker and a Hub. Hardware decisions here bring together engineering, design and operations, and clear explanations keep everyone aligned.
A choice like the ring fasteners, the foam method or the surface finish gets approved once and stays settled. It’s a small habit that protects schedule and keeps the engineering record clean.
Key Takeaways
Lead with the decision and the ask, and explain the failure before the fix. Back it with one engineering fact, not ten, then use one analogy and one picture. Compare options in a single table, translate one key number into plain words, and always state a risk and a fallback. Track approval time and follow-up questions to see whether it works.
Conclusion
Explaining a design decision is part of the design work. When a decision is easy to understand, it’s easy to approve.
Start with the answer, tell the story of the load path, and let one fact, one table and one picture carry the rest. Then measure the result, so the next explanation is faster than the last.