Inside a 44% Latency Cut and Why It Wasn't the Model
When users tell you "the chat feels slow," the first instinct is to blame the model. Bigger LLM, longer prompt, more retrieved context, those are the obvious suspects. But when we profiled our AI assistant's chat endpoint end to end, the model itself was already running about as fast as it could. The latency was hiding in plain sight, smeared across half a dozen small steps nobody had ever measured individually.
What followed was a multi-round optimization that cut mean response time by 44 percent and made the first word appear on screen twice as fast, without touching the model, the prompt, or any inference config. This is the story of where the time actually went, why most "RAG best practices" posts quietly skip the hard parts, and what we learned about the gap between throughput and perceived latency.
The pipeline everyone draws, and the one that actually runs
Most retrieval-augmented chat pipelines look the same on a slide: embed the user's question, look it up in a vector index, stuff the top chunks into a prompt, send it to the LLM, return the answer. Six boxes. Easy.
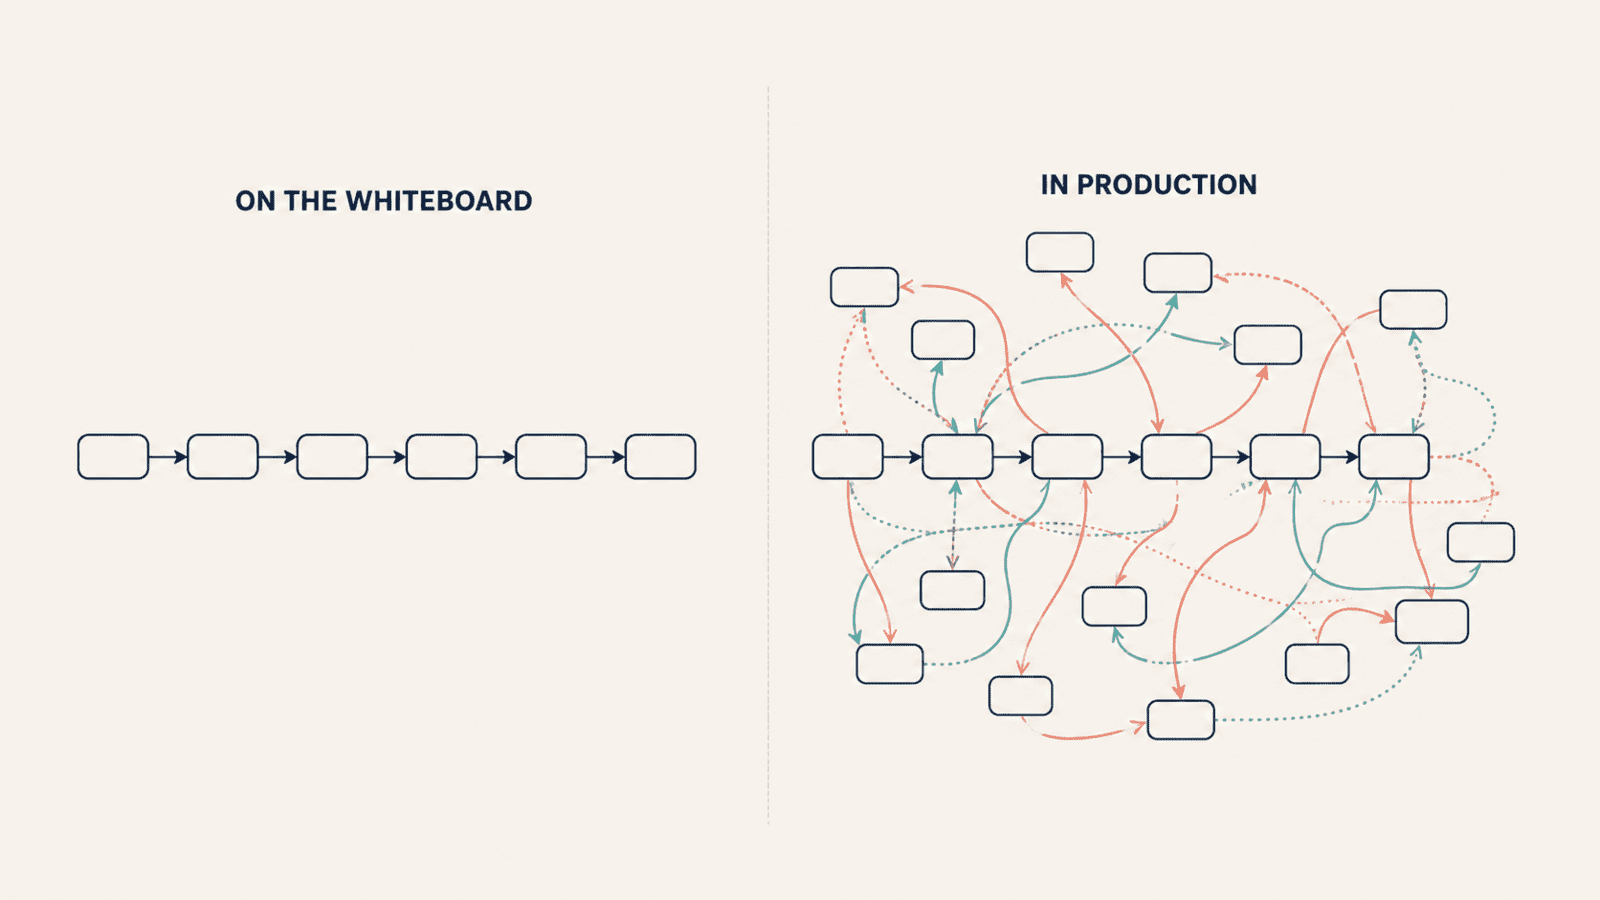
In production, that diagram is a lie. A real chat turn fans out across many more steps. It loads conversation history from one store and summaries from another. It fetches user and profile context to personalize tone or content. It hits one or two external HTTP services for ambient signals like location or time of day. It writes the request to a telemetry and billing log. It runs a summary-maintenance job to keep memory tractable as conversations grow. It writes the final answer to a persistent chat log.
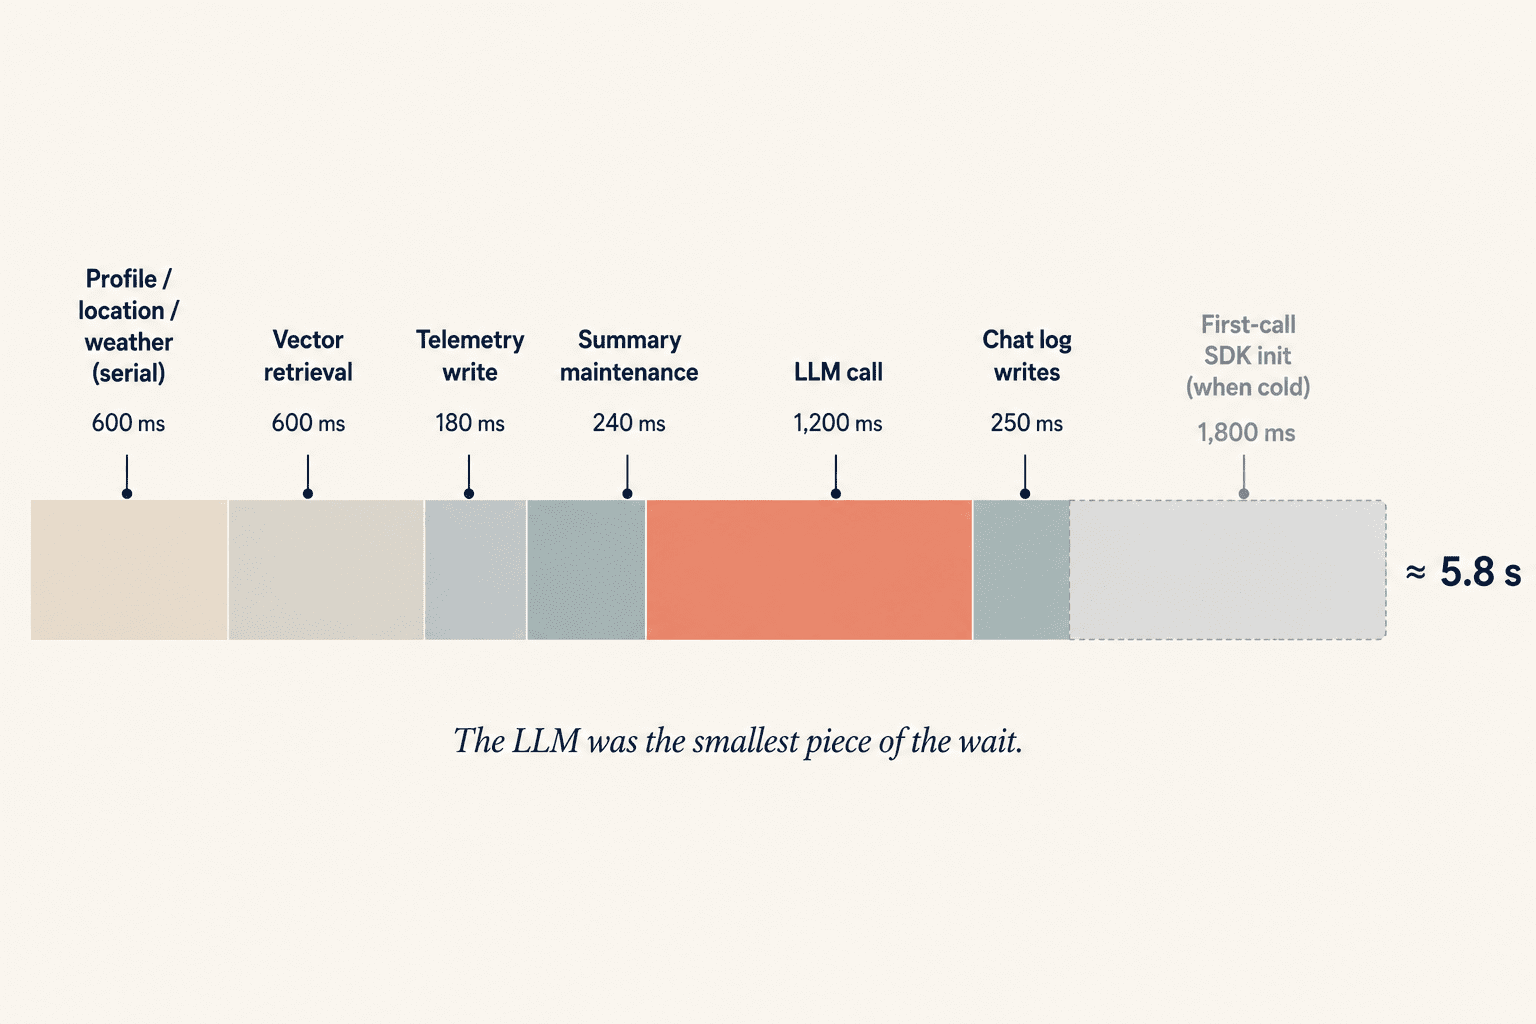
Each of these is fast on its own, tens to a few hundred milliseconds. Stacked together, they often outweigh the actual LLM call. And because most teams measure end-to-end latency without staging it, the only number anyone has is "around five seconds," a figure that hides everything actually wrong.
The profile that started everything
Before changing anything, we built a per-stage profiler keyed by request. Every named stage emitted a duration. After ten warm calls with an identical payload, the picture was clear: the LLM was responsible for less than a third of the wall time. The other two-thirds were context assembly, telemetry, and post-response housekeeping, all running serially on the request path.
A few patterns jumped out immediately. Independent reads were running sequentially, profile, location, and weather were three separate calls, and only one of them genuinely depended on another. Writes sat on the critical path, a telemetry write and a memory-maintenance job both fired before the response returned, even though neither needed to finish for the user to get an answer. And the cloud SDK paid a first-call tax: the very first request after a cold start ate a 4-second outlier, TLS, request signing, and connection pooling all happening lazily on the first inference call.
Round 1: parallelism and moving writes off the hot path
The independent reads were trivially parallelizable. A small shared thread pool with a join-when-all-done pattern collapsed the two independent reads into the time of the slower one, another 100 to 200 ms saved.
The bigger win was reframing what actually needs to be on the critical path. From the user's perspective, the request is done the moment the answer renders. A telemetry log doesn't need to be durable before the response goes out, it just needs to eventually land. A memory-maintenance job that keeps long conversations tractable doesn't need to block this turn, it needs to finish before the next turn, which is at minimum a few seconds away.
We moved both onto a background executor. The user's response now returns the instant the answer is ready, and the housekeeping happens after. That alone shaved another roughly 400 ms off the mean, and up to 1.25 s on runs where the maintenance job was doing real work.
Round 2: caching the boring things
User profile data changes rarely. Approximate location changes even more rarely. Weather changes hourly at best. All three were being fetched fresh on every chat turn.
We added a small in-process TTL cache with three carefully chosen lifetimes, short for things that can change due to user action, longer for things that change on a natural cadence. Crucially, the cache pairs with explicit invalidation hooks on the write paths: when a user updates their profile, we invalidate that cache entry immediately.
That's the only way TTL caching survives contact with reality. Without invalidation you've just traded latency for stale data, which is usually a worse bug than the one you set out to fix.
While we were in the area, the SDK client used to talk to our managed data store was being constructed inside the function on every call. Promoting it to a module-level singleton bought another 10 to 30 ms, small in isolation, free as a code change.
Round 3: the warm-up that killed the cold-start outlier
The 4-second first-call spike turned out to be lazy initialization inside the cloud SDK: TLS handshake, request signing, connection pool. We forced both the LLM client and the embedding client to make a trivial call at process boot. The cold outlier disappeared from p95 entirely.
The streaming pivot: making fast feel instant
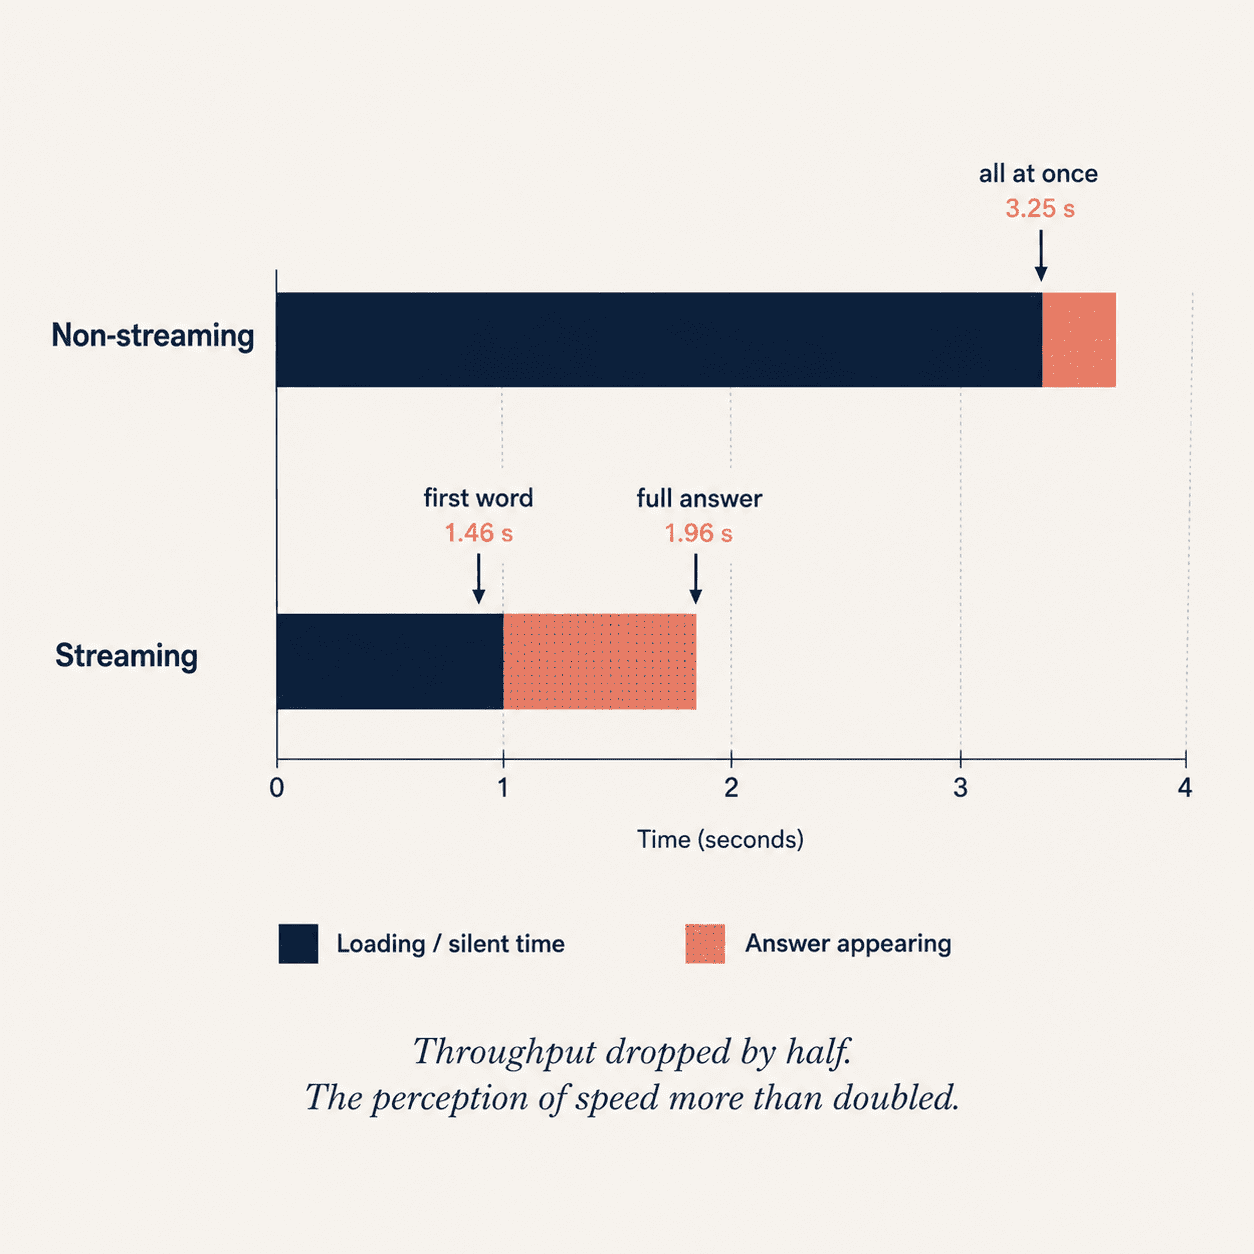
After four rounds, we'd cut mean wall time from 5,807 ms to 3,245 ms, a 44 percent throughput improvement with no change to model, prompt, or answer quality.
But 3.2 seconds is still 3.2 seconds. The user is staring at a loading indicator. So the last change wasn't numerical, it was philosophical: stop optimizing throughput, start optimizing time-to-first-word.
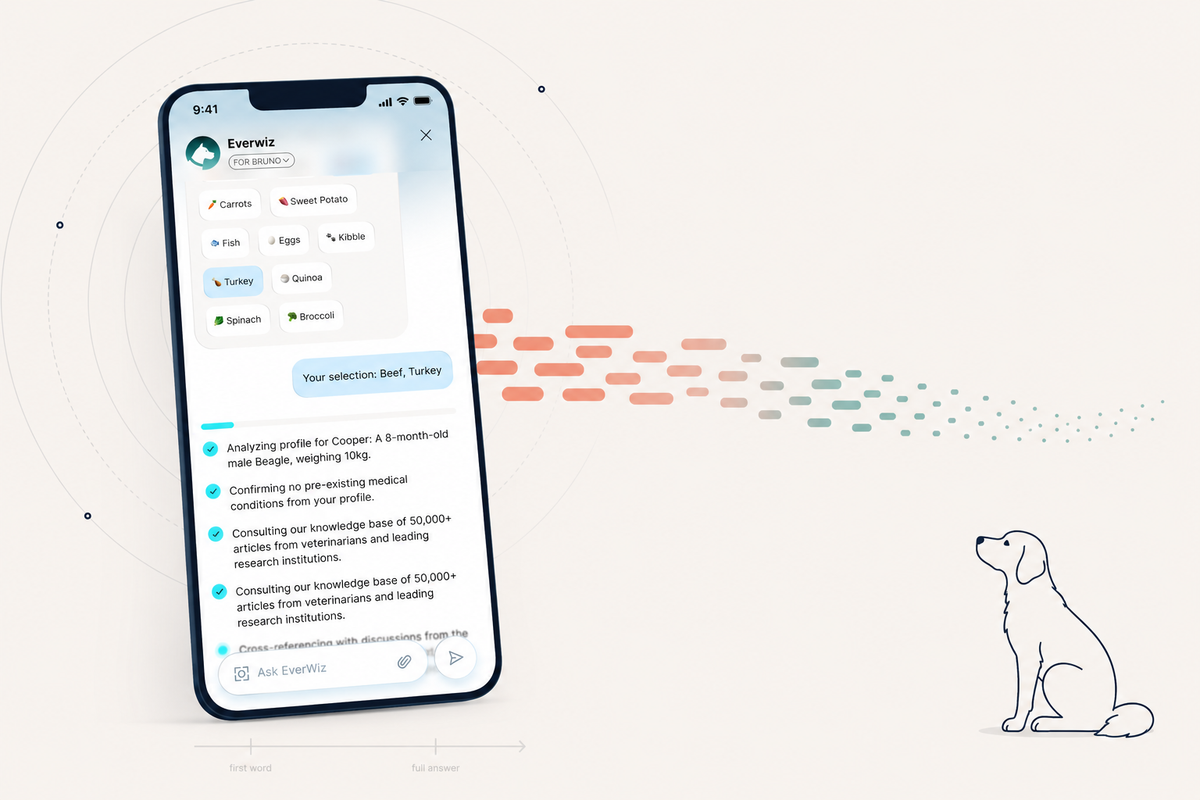
We added a streaming endpoint alongside the original. The LLM provider already supported token-by-token streaming over a server-sent-events connection, so we exposed it. The mobile client opens an SSE connection, the answer renders one token at a time as it arrives, and follow-up suggestions get fetched after the stream completes without blocking it.
The first visible word now appears in about 1.5 seconds on a warm path. The full answer lands by about 2 seconds. Throughput didn't actually improve, the total work is roughly the same, but the user perceives the assistant responding twice as fast, because they see it responding immediately.
That's the single most useful insight from the project: throughput optimization has a floor, perceived-latency optimization does not.
The results
Every optimization was guarded by an invariance test that pinned every external input and byte-diffed the exact payload sent to the model. No optimization shipped if it changed what the model saw. That let us refactor aggressively without wondering whether answer quality had drifted, and it kept the streaming and non-streaming paths producing identical results.
Key takeaways
Profile by stage, not end to end. A single duration tells you nothing; per-stage timings tell you which assumption to question first.
Delete before you cache. Code paths that grew organically have free wins hiding in duplication.
Move writes off the critical path. Telemetry, persistence, memory maintenance, none of it needs to block the user. The "background work" pattern is undersold.
TTL caches without invalidation are just bugs. Pair every cache with an explicit invalidation hook on every write path.
Warm SDK clients at boot. Lazy initialization is invisible on the mean and ugly on p95.
Streaming beats throughput for chat UX. Once users see words appearing, "slow" stops being a complaint.
Guard refactors with invariance tests. If you can prove the model sees the same bytes, you can rewrite the surrounding code with confidence.
Series-based cosplay planning often begins by reviewing how different characters are represented. The available options can be reviewed without assuming that one costume fits every purpose. For event or photo planning, Demon Slayer cosplay costumes for photo shoots(鬼滅の刃 撮影用コスプレ衣装) keeps the selection connected to the intended series. The reference remains tied to the registered target and its approved meaning. Series-level planning works best when each character design is reviewed on its own terms. No single design should be treated as representative of every character in the work.