Scoped Streams, Stable Real-Time Visuals
Real-time apps are at their best when they feel calm. Numbers update, charts glide, tiles pulse with new information—but nothing spikes, freezes, or drifts. The UI feels more like a live instrument panel than a slideshow. To get there, though, you need more than a WebSocket and a couple of StreamBuilders. You need a design where streams have clear lifetimes, state is scoped to the UI that owns it, and the backend respects the limits of the client.
We’ll walk through how to build scoped, reference-counted streams and long-lived UIs that can run for hours without leaking, even when the backend is streaming device telemetry or time-series data at high frequency. The ideas map nicely onto stacks like Flutter + Python (FastAPI, asyncio, WebSockets), but nothing here is tied to a single framework. Think in terms of client, session manager, and real-time backend, and you can transplant these patterns anywhere.
Why Scoped Streams Matter in Real-Time Products
A real-time product is not just “an app with a chart.” It’s a system where:
- Data flows continuously from devices or services.
- Users leave the app open for long periods.
- Navigation, reconnects, and backgrounding are the norm, not edge cases.
Without discipline, you end up with:
- Streams that live longer than any screen that uses them.
- Subscriptions attached to widgets instead of features.
- Duplicate listeners for the same topic, each doing redundant work.
- Backends that blast raw events faster than the UI can paint.
The symptoms show up slowly: memory creep, GC churn, occasional dropped frames, charts that lag after navigation. You restart the app and everything is fine—for a while.
The fundamental fix is scoping: deciding where each stream is allowed to live and who is allowed to talk to the backend. Once those boundaries are explicit, memory leaks and redraw storms get a lot harder to accidentally create.
Three Lifetimes: Session, Feature, Widget
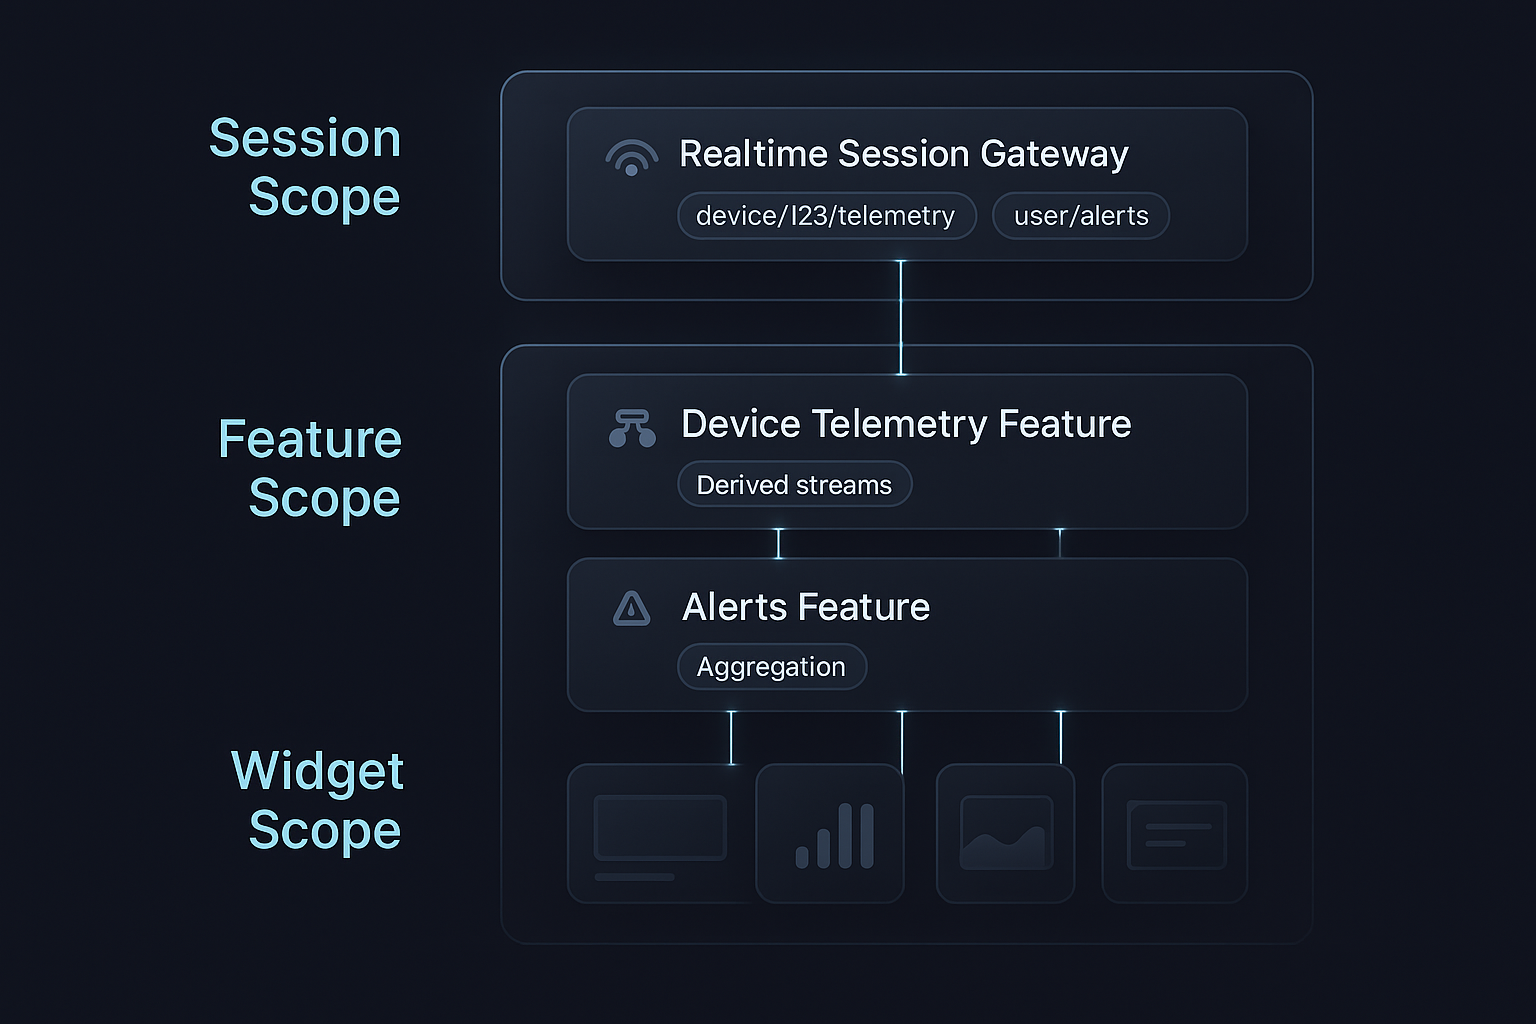
A simple rule of thumb: every stream in your app must belong clearly to one of three lifetimes.
- Session scope – lives for the whole logged-in session (or app runtime).
- Feature scope – lives for as long as a route/tab/screen is active.
- Widget scope – lives for as long as a specific view subtree is mounted.
Most teams get into trouble when they let session concerns leak into widgets or let features talk to the backend directly. Instead, think of the three scopes as layers:
- Session: owns the real-time connection and acts as the stream gateway.
- Feature: owns domain logic and transforms the raw streams.
- Widget: owns only presentation and local UI quirks.
For example, in a data-driven mobile app that plots sensor metrics in real time:
- The session layer establishes a single WebSocket and routes messages by topic.
- The feature layer asks the session layer for a topic stream, down-samples it, aggregates it, and exposes a “chart-ready” stream to the UI.
- The widgets render charts and tiles from that processed stream without knowing anything about the transport.
This separation is what lets you add more sensors, more tabs, or more device types later, without turning your stream layer into a ball of mud.
Designing the Session Layer: One Gateway, Many Topics
The session layer is the only part of the client that talks to the real-time backend directly. Conceptually, it behaves like this:
- Owns a single connection (WebSocket/SSE/whatever).
- Understands a topic model (e.g.,
"device/123/telemetry"). - Maintains a topic registry and reference counts.
- Demultiplexes incoming messages by topic and publishes them to per-topic subjects.
The moment a second component tries to open its own WebSocket, you should have to justify it very carefully. Most of the time, a single, well-designed session gateway is enough.
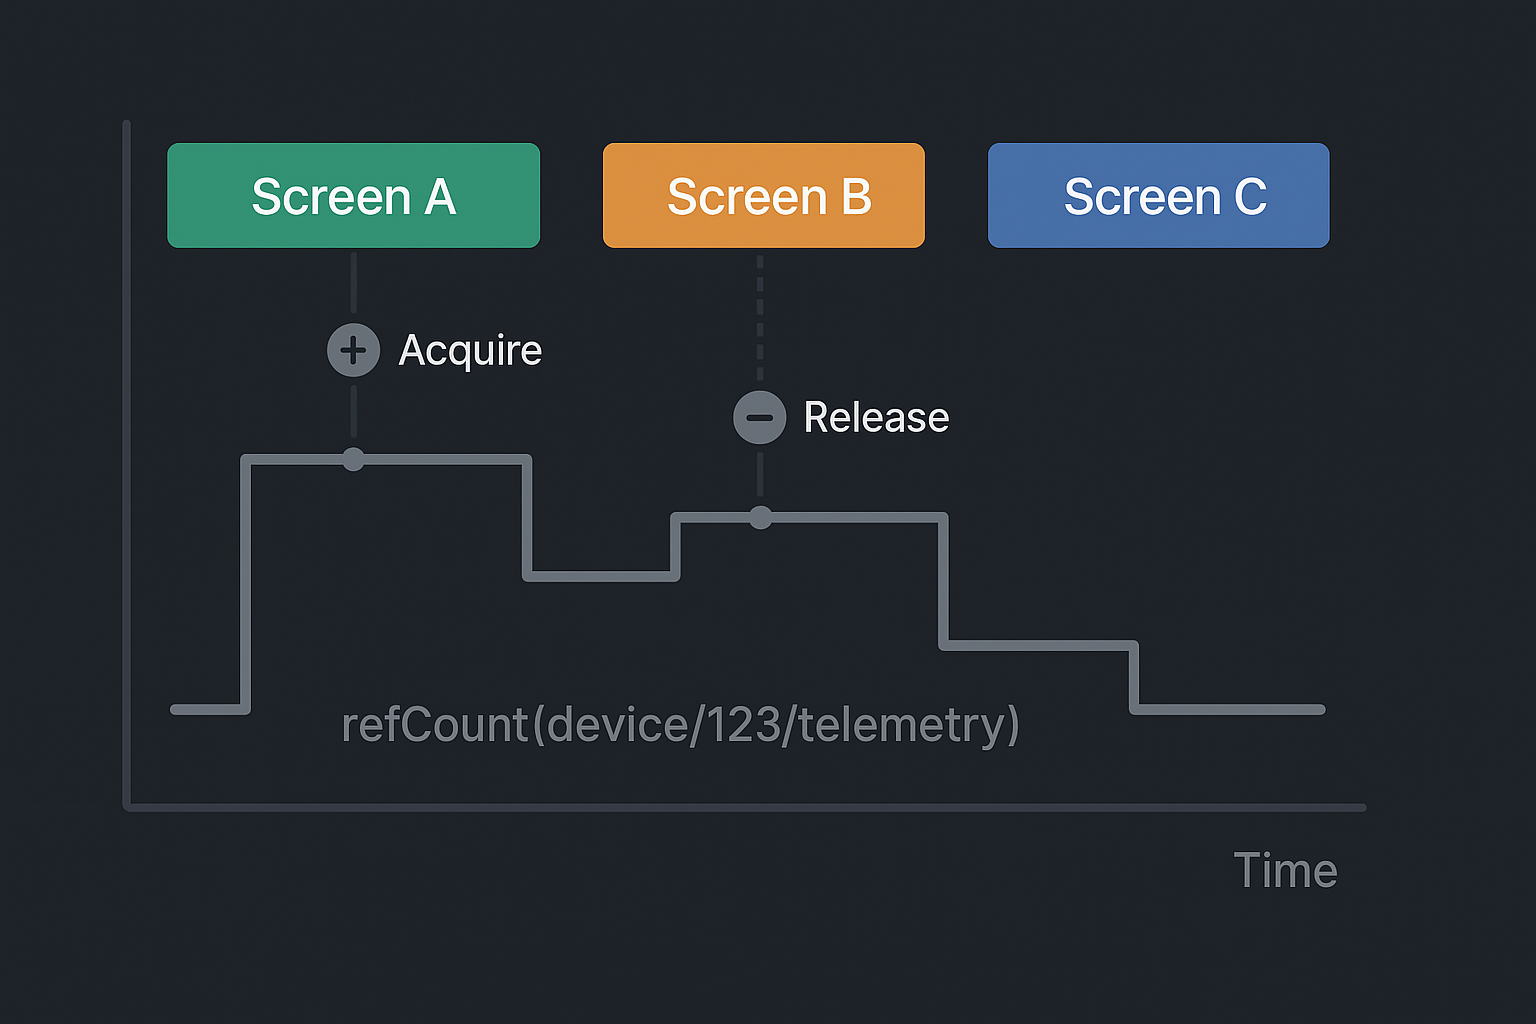
1. Topic Registry and Reference Counting
Internally, you can structure the session gateway around two maps: one from topic name to subject, and one from topic name to refCount:
class SessionStreams {
  final _subjects = <String, BehaviorSubject<dynamic>>{};
  final _refCounts = <String, int>{};

  Stream<T> acquire<T>(String topic) {
    _refCounts[topic] = (_refCounts[topic] ?? 0) + 1;

    final subject = _subjects.putIfAbsent(
      topic,
      () {
        // Optionally send 'subscribe(topic)' to backend here
        return BehaviorSubject<dynamic>();
      },
    );

    return subject.cast<T>();
  }

  void release(String topic) {
    final next = (_refCounts[topic] ?? 0) - 1;
    if (next <= 0) {
      _refCounts.remove(topic);
      _subjects.remove(topic)?.close();
      // Optionally send 'unsubscribe(topic)' to backend here
    } else {
      _refCounts[topic] = next;
    }
  }

  void handleIncoming(String topic, dynamic payload) {
    _subjects[topic]?.add(payload);
  }
}
The logic is straightforward but powerful:
- Features ask for a topic stream via
acquire(topic). - The gateway returns the same subject for all callers, incrementing the reference count.
- When features are done, they call
release(topic). - When the count drops to zero, the subject is closed and the backend can be told to unsubscribe.
You have effectively created a multiplexed pub-sub connection where the backend sees a single socket, and the client gets many typed streams with automatic lifetime management.
2. Topic Names as Contracts
Topic names should not be arbitrary string literals scattered through your code. They define a contract between backend and client, and between session layer and feature layer.
Instead of "telemetry_stream", prefer structured identifiers like:
"device/{deviceId}/telemetry""device/{deviceId}/alerts""user/{userId}/notifications"
On the backend, routing tables and aggregators understand these strings. On the frontend, features call acquire("device/$id/telemetry"). Logs and debugging tools can list topics by these same IDs.
This is particularly handy in multi-device ecosystems (e.g., a wearable on the pet, a smart feeding bowl in the kitchen, a hub device in between). Even if the payload formats differ, the transport model stays consistent.
The Feature Layer: Turning Raw Events into UI-Ready Streams
If the session layer’s job is “get data in,” the feature layer’s job is “shape data for humans.” This is where you:
- Separate event rate from paint rate.
- Compute derived state (flags, aggregates, alerts).
- Enforce bounds on how much data the UI must handle.
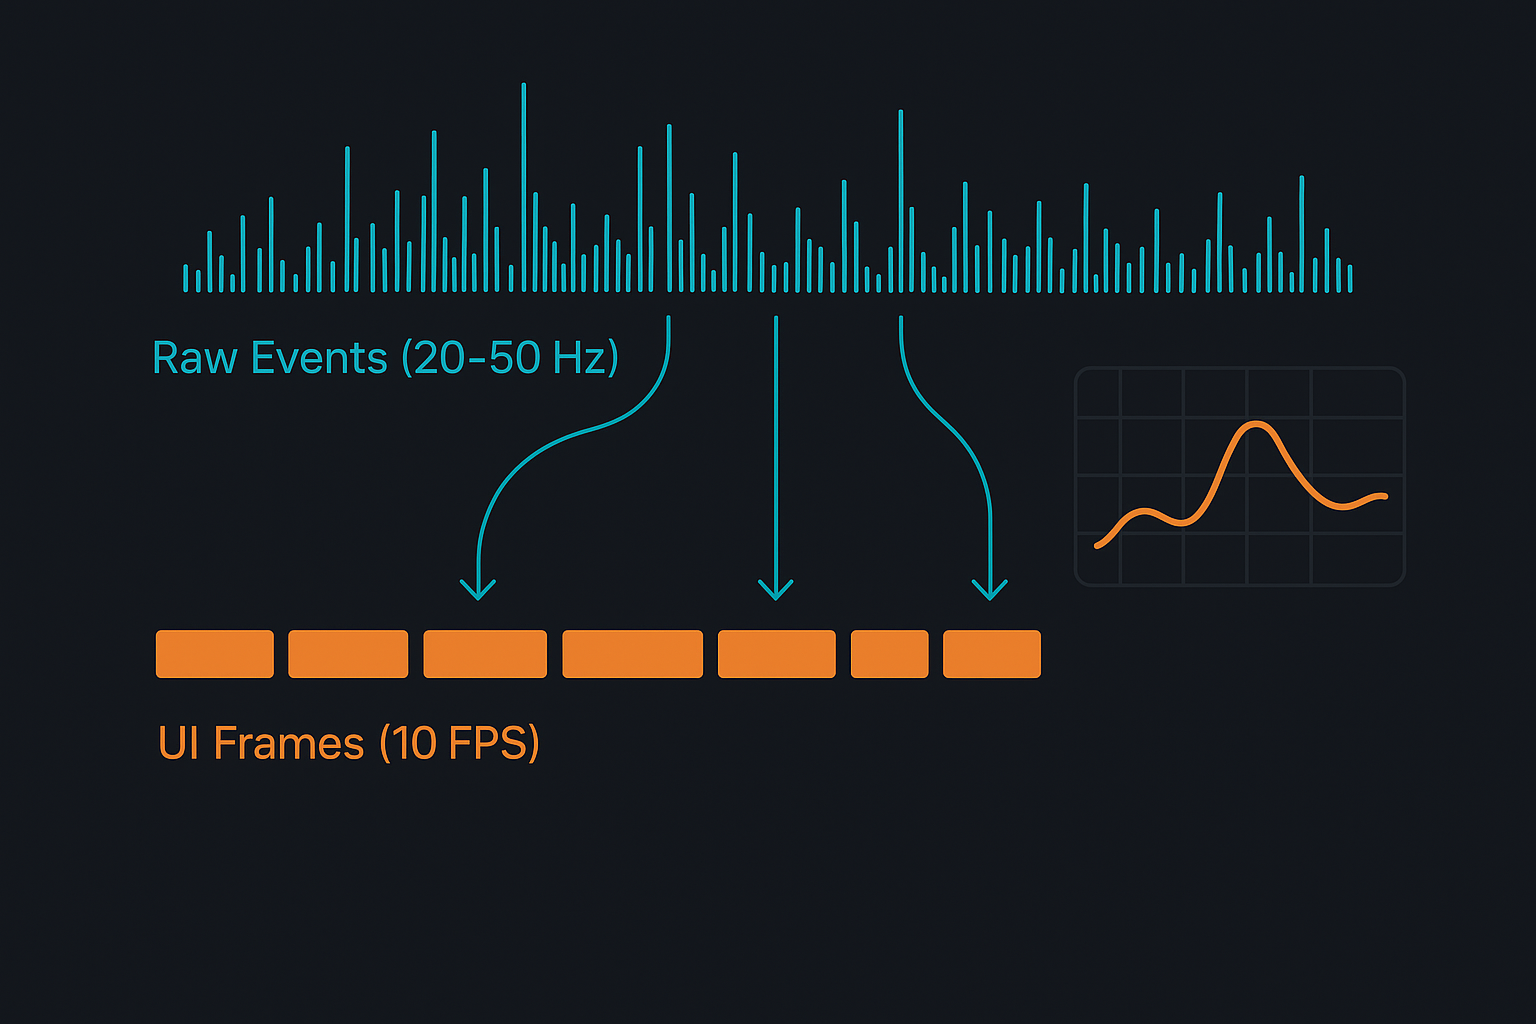
1. Event Rate vs Paint Rate
Imagine telemetry coming in at 50Hz for an accelerometer or at 10Hz for bowl weight. Sending every event directly into a chart widget is the fastest way to:
- Overload the charting library.
- Flood the garbage collector with tiny objects.
- Turn smooth scrolling into a slideshow.
A better pattern is to treat the raw per-event stream as input, and expose a second, derived stream of frames at a much saner rate, for example 5–10 updates per second for a chart.
class ChartStream {
  final Stream<List<DataPoint>> frames;

  ChartStream(Stream<DataPoint> raw)
      : frames = raw
          .bufferTime(const Duration(milliseconds: 100))
          .where((batch) => batch.isNotEmpty)
          .map((batch) => _mergeIntoWindow(batch));

  static List<DataPoint> _mergeIntoWindow(List<DataPoint> batch) {
    // Append to a circular buffer and return the visible window.
    // Implementation details depend on your chart’s model.
  }
}
The feature owns the raw stream, the buffer, and the windowing logic. The widget sees only frames: Stream<List<DataPoint>>, which is stable, bounded, and easy to reason about.
You can tune:
- The buffer window size (e.g., 100 ms vs 250 ms).
- The window length (e.g., last 30 seconds vs last 5 minutes).
- The aggregation logic (downsample, average, min/max per bucket, etc.).
All of this lives in the feature layer, not in the widget and not in the session manager.
2. Derived Flags and Aggregates
Most real-time screens need more than raw series:
- A status indicator (“streaming”, “paused”, “stale”).
- Summary tiles (e.g., “last 10 minutes: avg X, max Y”).
- Simple booleans (“isAlerting”, “hasRecentData”).
These can be built as small streams derived from the main frame stream, and your widgets can subscribe selectively. For example:
- A header bar observes a
Stream<ConnectionStatus>. - A small pill observes
Stream<bool>for “alert active.” - A chart tile observes only
Stream<List<DataPoint>>.
This keeps each widget focused and prevents them from reacting to irrelevant changes.
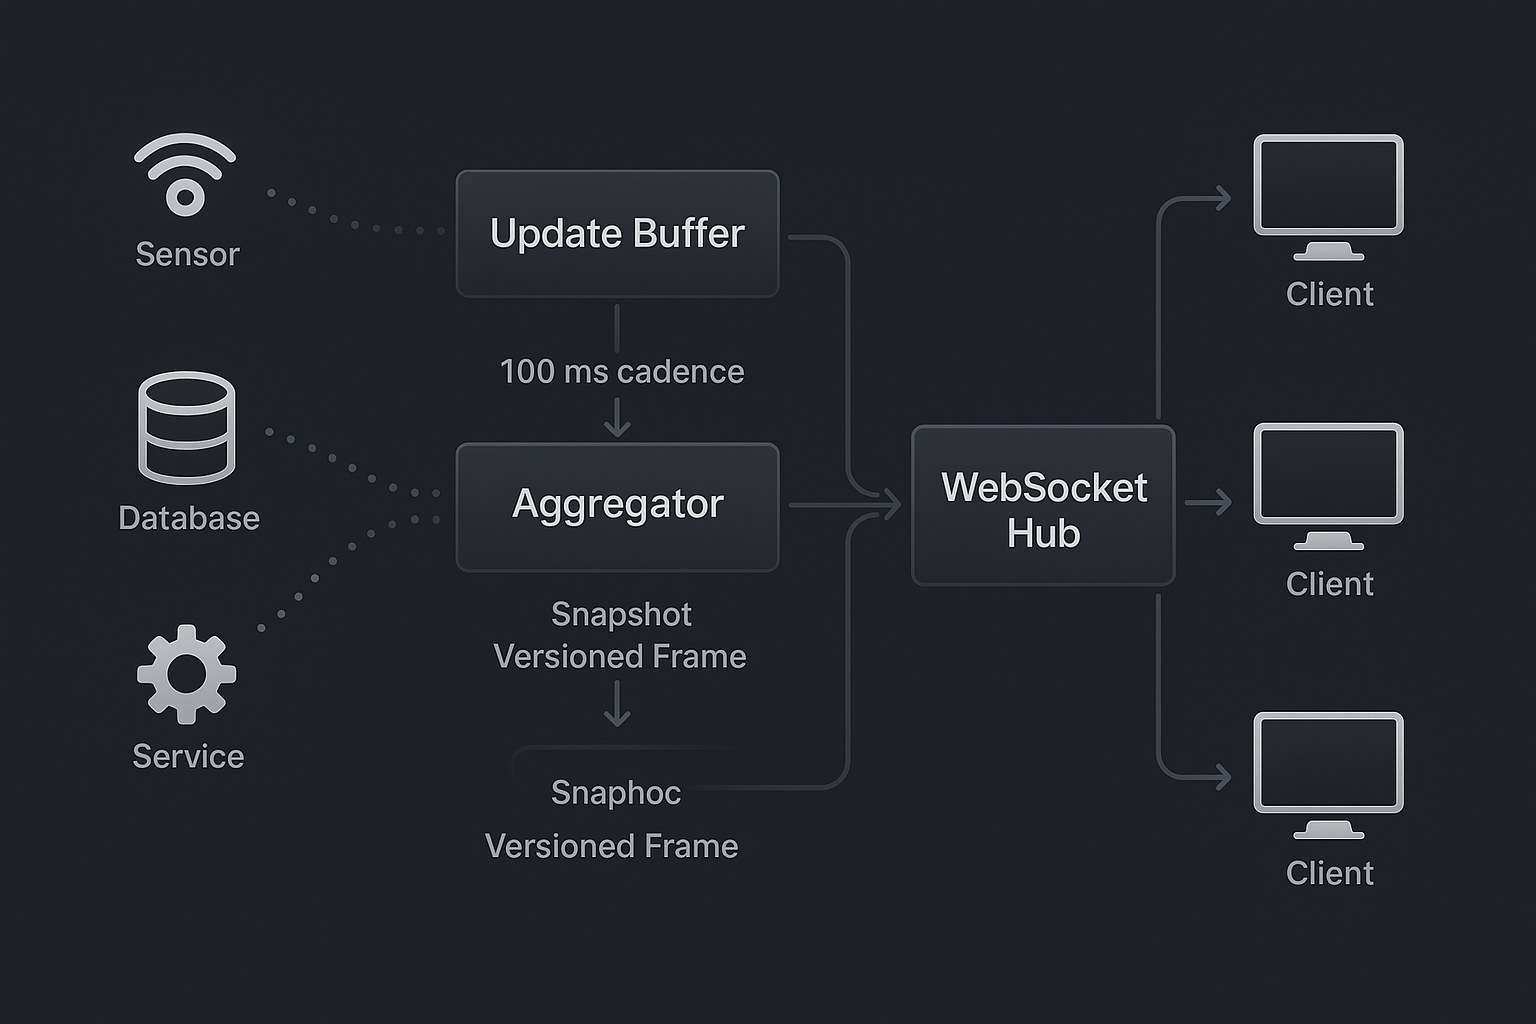
Backend Responsibilities: Aggregation, Not Megaphone
A stable client can still struggle if the backend behaves like a firehose. If every sensor tick or DB write is forwarded verbatim to the socket, the client is left doing:
- Excess JSON parsing.
- Per-message routing.
- Fine-grained state recomputation.
You get better results when the backend acts as an aggregator that publishes state frames at a controlled cadence.
1. Per-Topic Aggregation Loops
On the server, think in terms of topic channels. Each channel:
- Maintains a mutable state object (e.g., last known telemetry).
- Accepts deltas from upstream sources (sensors, DB, services).
- Periodically broadcasts a snapshot of the current state to all subscribers.
Here’s a stripped-down sketch in Python-style pseudocode:
class TopicChannel:
    def __init__(self, topic: str):
        self.topic = topic
        self.state = {}          # current snapshot
        self.subscribers = set() # connected websockets
        self._lock = asyncio.Lock()

    async def apply_delta(self, delta: dict):
        async with self._lock:
            self.state.update(delta)

    async def broadcast_loop(self, interval: float):
        while True:
            await asyncio.sleep(interval)
            async with self._lock:
                if not self.subscribers:
                    continue
                frame = dict(self.state)
            message = {
                "topic": self.topic,
                "version": int(time.time() * 1000), # or monotonic counter
                "timestamp": datetime.utcnow().isoformat() + "Z",
                "state": frame,
            }
            for ws in list(self.subscribers):
                await ws.send_json(message)
Now the backend controls:
- Cadence – how often frames are sent for each topic.
- Shape – the structure of the state object the UI consumes.
- Consistency – each frame is internally coherent.
If you need deltas for bandwidth reasons, you can emit patch objects instead of full state, but the key idea remains: aggregation happens server-side, not in every client independently.
2. Metadata for Robust Clients
Each frame should carry a small set of metadata that makes client logic simpler:
- A version or sequence number to detect out-of-order delivery.
- A server timestamp to measure freshness and latency.
- Optional source tags if multiple pipelines feed the same topic.
With that, the client can:
- Ignore stale frames that arrive late.
- Display “stale data” warnings if no fresh frame arrives within a threshold.
- Infer approximate end-to-end latency for debugging.
In a pet-tech setting like Hoomanely, these details decide whether a parent can trust that the bowl weights and activity readings they see are “live enough” to adjust feeding or exercise on the spot.
3. Handling Backpressure and Slow Clients
When many clients subscribe to a hot topic, or some devices run on weak networks, you need a backpressure strategy. A simple but effective one:
- Maintain a small outgoing queue per client.
- If the queue grows beyond a limit, drop intermediate frames and keep only the latest.
- In more strict setups, close the connection and rely on client reconnection.
Because the frames are self-contained snapshots, it’s safe for a client to miss some of them and still converge on the latest state. The client’s session layer doesn’t need to replay any backlog; it just keeps processing whatever frames arrive, in order.
Reconnects, Navigation, and “Ghost” Listeners
Real-time connections don’t exist in a vacuum. Users switch between Wi-Fi and mobile data, background the app while they commute, and bounce between multiple real-time screens.
If reconnects and navigation logic are scattered across features, “ghost” listeners are almost guaranteed: abandoned subscriptions whose owners no longer exist.
1. Centralized Reconnect Strategy
Connection management belongs in the same place as topic management: the session layer.
A robust session gateway:
- Tracks connection state (
disconnected,connecting,connected,backoff). - Applies exponential backoff between attempts.
- On successful reconnect, replays the set of active topics to the backend (
subscribe(topic)for each topic withrefCount > 0). - Surfaces a minimal connection status stream to features.
Features then become almost stateless regarding connectivity. They listen to their topic streams and optionally to a lightweight “connection status” stream to show badges like “Reconnecting…” in the UI, but they never handle reconnection themselves.
2. Feature Tear-Down Discipline
On the feature side, you want a simple invariant: every acquisition of a topic has a matching release when the feature is destroyed.
A base class can enforce most of this:
abstract class RealtimeFeatureBase {
  final SessionStreams session;
  final _topics = <String>[];

  RealtimeFeatureBase(this.session);

  Stream<T> topic<T>(String name) {
    _topics.add(name);
    return session.acquire<T>(name);
  }

  @mustCallSuper
  void dispose() {
    for (final t in _topics) {
      session.release(t);
    }
  }
}
Concrete feature controllers or view models extend this class, call topic<T>("device/$id/telemetry") instead of hitting the session manager directly, and make sure to call super.dispose() in their own tear-down paths.
That one small pattern dramatically lowers the chance that a screen that has been popped off the navigation stack is still holding onto a live telemetry stream.
3. Spotting Ghosts with Diagnostics
Because topics and refCounts are tracked centrally, it’s easy to expose diagnostics for internal builds:
- A list of active topics, their reference counts, and last frame timestamps.
- A log view of topic acquisitions/releases over time.
- A “leak detector” that asserts refCounts for certain topics return to zero after scripted navigation.
Simple scripted tests—open and close the same telemetry screen 100 times—should show the topic table returning to the same baseline. If the refCounts drift upward, you have a leak.
Observability and Test Strategy
Even with good architecture, you only gain confidence when you see the system behave under stress.
On the client side, instrument the session layer and feature base classes to emit simple metrics:
- Number of active topics.
- Total refCount sum.
- Approximate messages per second per topic.
- Connection state transitions.
Combine that with platform tools (memory graphs, CPU sampling) and you can correlate:
- Topic counts vs memory usage over time.
- Connection flaps vs UI responsiveness.
- Navigation patterns vs refCount spikes.
On the backend, track:
- Frames per second per topic.
- Per-client send queue lengths.
- Average frame size and serialization time.
Then build a small suite of test scenarios, even if they’re just scripts run locally:
- Rapidly switching between multiple telemetry screens.
- Leaving a dashboard open while data streams in for an hour.
- Simulating network drops on an emulator/device and watching reconnect behavior.
You’re aiming for flat lines in the right places: memory and topic count should stabilize, not grow unbounded. CPU utilization should show predictable spikes when heavy charts are visible, not random bursts when the app is backgrounded.
At Hoomanely, the mission is to give pet parents a clearer, more data-driven view of their pet’s health: feeding patterns, activity levels, and subtle changes in day-to-day behavior. That vision only works if the real-time surfaces are trustworthy.
For devices like Everbowl and EverSense, telemetry flows constantly. Parents open the app to see live bowl weight or recent motion trends; they don’t want to think about streams, reconnections, or memory. They just expect the UI to stay responsive and meaningful over time.
The scoped stream architecture described here is what lets the product behave that way:
- A single, disciplined session gateway instead of ad-hoc sockets.
- Feature controllers that treat raw telemetry as just another input, shaping it into charts, tiles, and alerts.
- Backends that aggregate and frame data with the UI’s limits in mind.
Those same patterns apply beyond pet-tech: financial dashboards, logistics tracking, industrial monitoring—anywhere that “refresh every 5 seconds” has been replaced by “always live.”
If you want a simple mental model to carry into your next real-time project, make it this:
- One connection, many topics, scoped carefully.
- Session layer talks to the network; features talk to the session layer; widgets talk to features.
- Backends publish frames, not firehoses.
When you design with those principles from day one, the rest of the tech stack—whether it’s Flutter and Python, something web-based, or another combination entirely—has a solid foundation to sit on. Your charts will still be animated, your tiles will still glow with fresh data, but under the hood the system will be doing something far less exciting: Staying stable.